With the Calico Enterprise 3.10 release, Dynamic Packet Capture is available in Dynamic Service Graph.
This means users who require self-service, live troubleshooting for microservices and Kubernetes workloads can capture and evaluate traffic packets on endpoints without writing a single line of code or using any 3rd-party troubleshooting tools. Users don’t need to learn about or have knowledge of kubectl or YAML to troubleshoot their microservices and Kubernetes cluster. Calico helps enforce organizational security policies by only allowing users to access their assigned namespaces and endpoints for troubleshooting.
About Dynamic Packet Capture
In most situations when you need to do a packet capture, the problem doesn’t last long and usually happens randomly. But once you narrow down the issue to a particular time or activity, you will need to set the right action plan to tackle the problem. Packet capture is now much easier, simpler, and faster than before.
Dynamic Packet Capture facilitates fast troubleshooting and easy debugging of microservice connectivity issues and performance hotspots in Kubernetes clusters. It is a Kubernetes-native custom resource that runs as part of user code against specific workloads in the cluster, without the need to execute any programs inside the cluster. Dynamic Packet Capture integrates with Kubernetes rule-based access control (RBAC), which allows teams to troubleshoot workloads within their own namespaces without affecting the rest of the Kubernetes cluster. Additionally, within the same cluster or namespace, the RBAC integration helps differentiate between who can run the packet capture and who can retrieve the captured files.
Four things you can do with Dynamic Packet Capture
Users can now take advantage of Dynamic Packet Capture in the following four ways:
- Run packet capture whenever you want (available 24/7)
- Preschedule packet captures to start and stop when needed
- Customize packet captures according to port, protocol, and namespace
- Share and collaborate packet capture jobs
Run packet capture whenever you want (available 24/7)
With Dynamic Packet Capture in Dynamic Service Graph, all it takes is a single click to start a packet capture based on the user’s role assigned in the namespace.
Let’s see how it works!
Complete the following steps to run a packet capture:
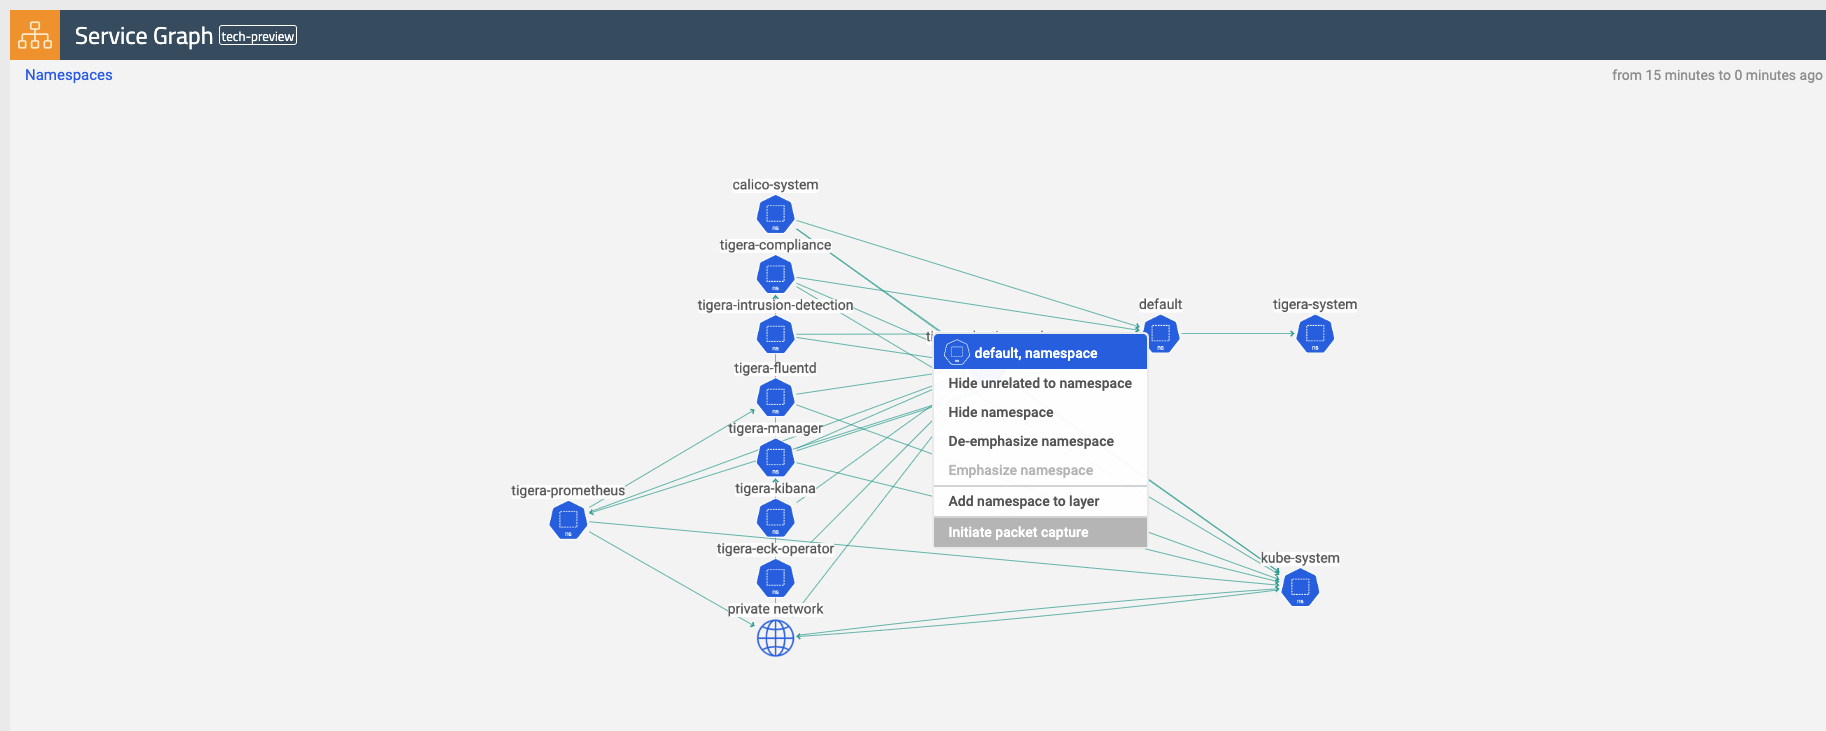
- Select an endpoint from the dynamic service graph.
- From the service graph view, select the namespace, right-click, and select initiate packet capture.
Preschedule packet captures to start and stop when needed
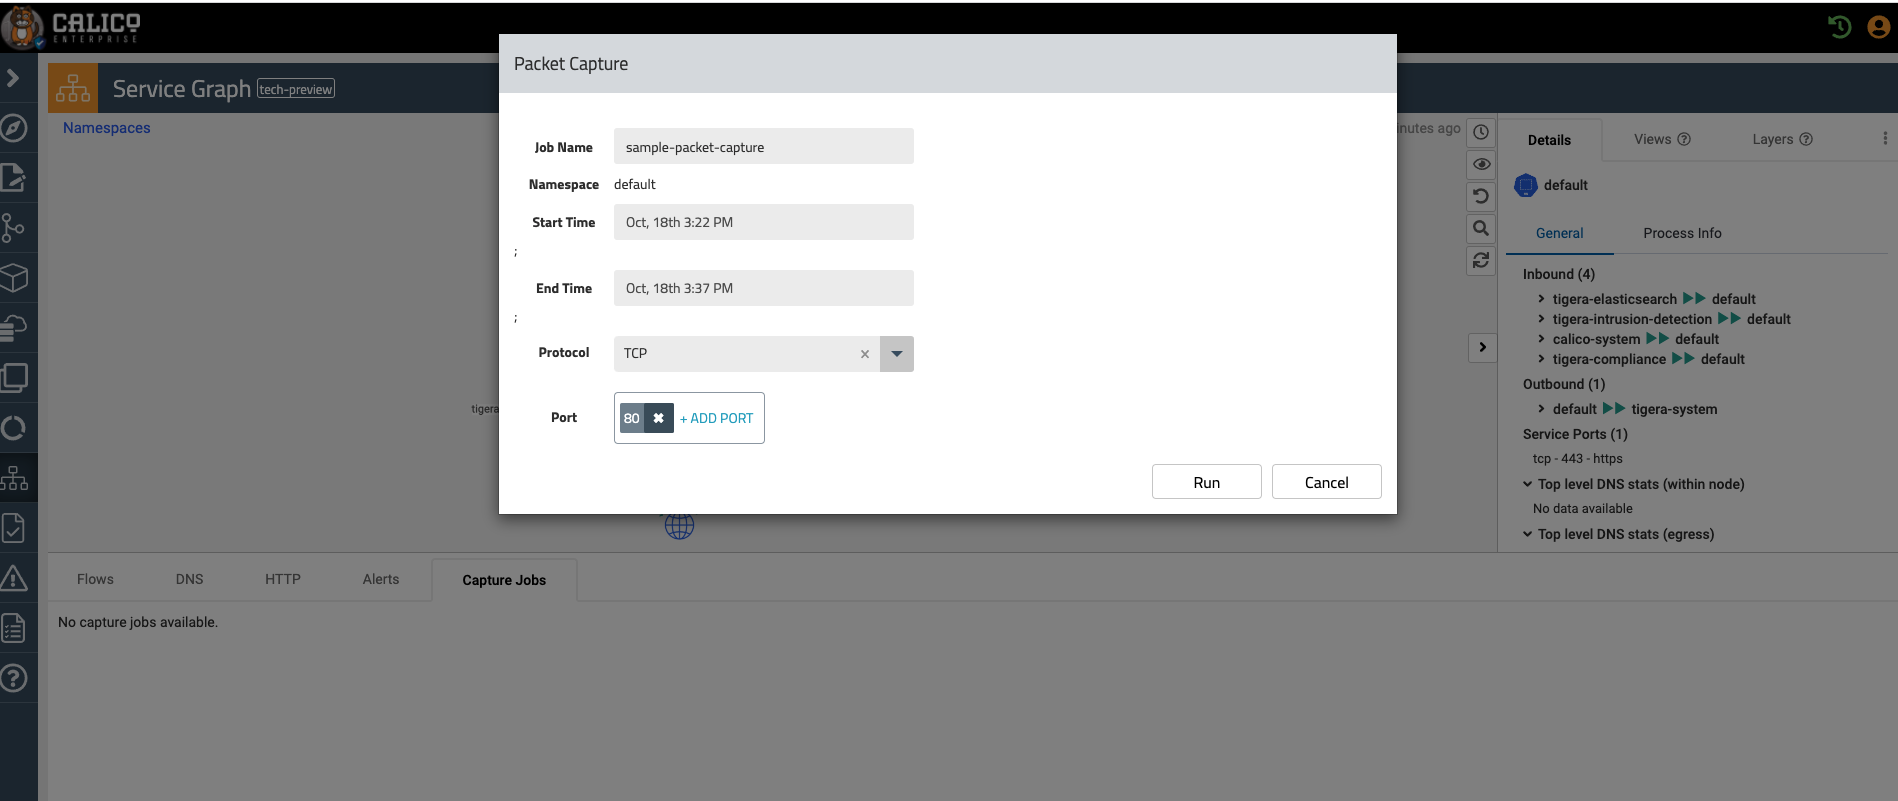
Schedule a traffic capture for 5 minutes between 3:32 UTC and 3:37 UTC for all workload endpoints in the sample namespace.
Customize packet captures according to port, protocol, and namespace
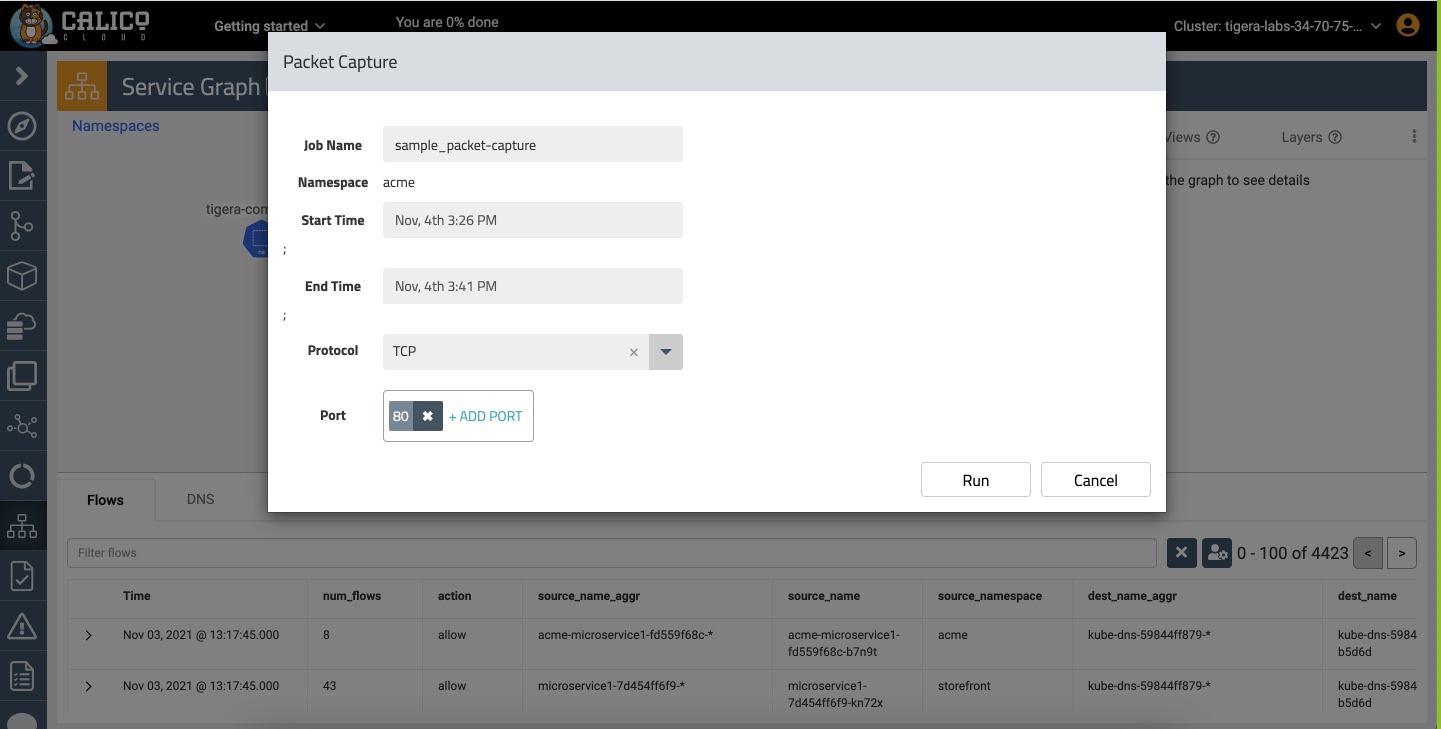
Give the packet capture job a name and select a time interval, port, and protocol. Then click Run.
Share and collaborate packet capture jobs
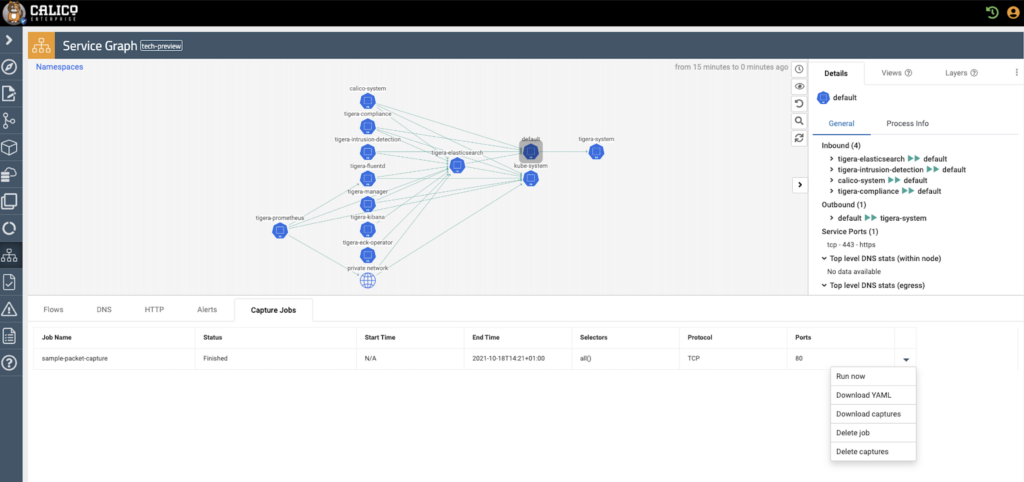
From the Capture Jobs tab in the bottom panel, you can:
- Rerun/stop a capture job
- Retrieve and delete capture files
- View YAML files
- Delete a capture job
Conclusion
Now you have everything you need to troubleshoot your microservices and applications quickly and efficiently. If you prefer to have packet capture as part of your code, refer to the example of the packet capture manifest files in this article.
Ready to try Dynamic Packet Capture for yourself? Get started with a free Calico Cloud trial.
Join our mailing list
Get updates on blog posts, workshops, certification programs, new releases, and more!
