







Track egress connections and identify domains contacted by workloads to support DNS-based policy creation and issue troubleshooting.
Solution
Calico Dashboards
Gain deep insights into your Kubernetes clusters, enabling proactive monitoring, fast troubleshooting, and policy refinement.
Benefits
Visualize your Kubernetes cluster communication, streamline your network policies, and improve incident response times

Quickly Respond to DNS Issues
Reduce downtime and mitigate issues related to DNS misconfigurations

Simplify Policy Management
Visually examine traffic flows to help create, test, and refine network policies

Optimize Application Performance
Pinpoint latency and round-trip time issues to improve application performance
Trusted by Customers Worldwide



















Flow Log Analysis
Provide real-time visibility into network traffic, enabling teams to monitor, diagnose, and quickly troubleshoot connectivity issues.
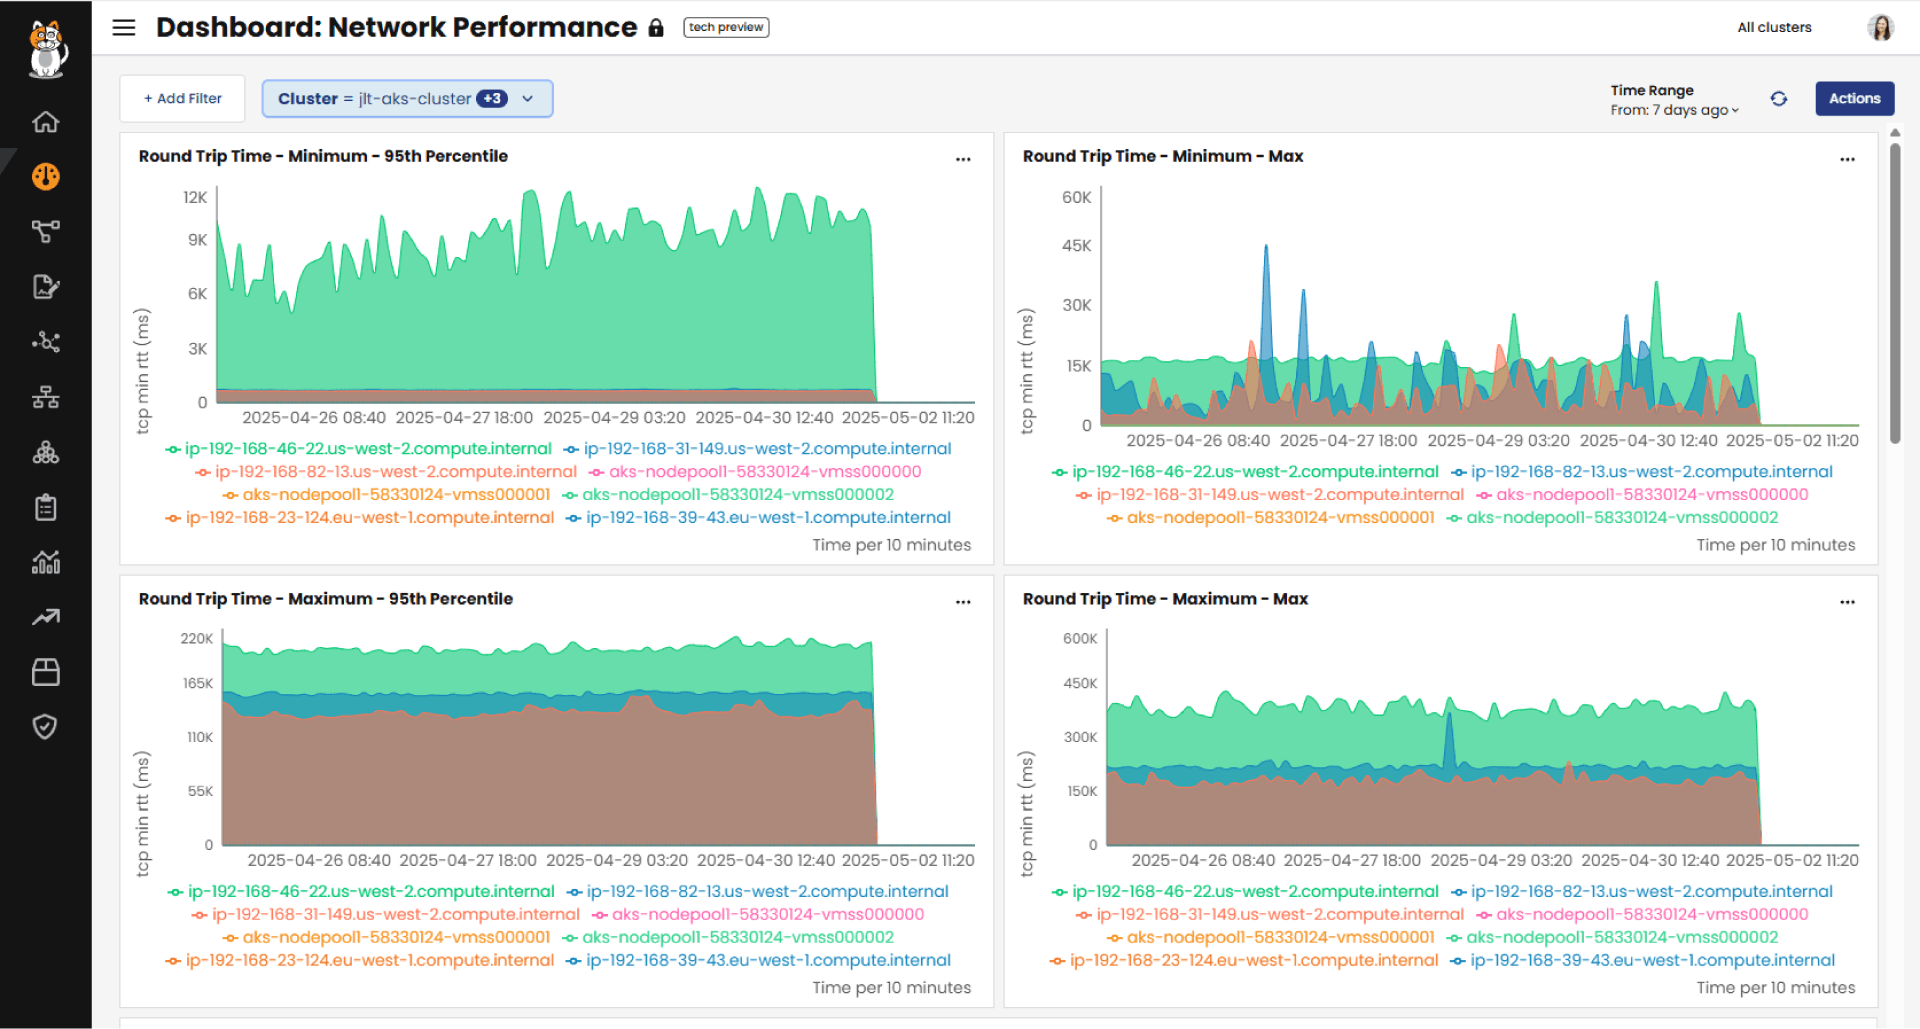
Network Performance Metrics
Identify latency and round-trip time issues, allowing teams to troubleshoot bottlenecks and improve application performance.

Customizable Dashboards
Create custom dashboards by editing existing cards to show data from flow, DNS, L7, and other logs— and customize and save queries, filters, and visual settings.

Role-Based Access Control (RBAC)
Provision granular and secure dashboard access to a broader set of users, including admins, DevOps, and developers.
Available on Microsoft Azure, AWS, and Google Marketplace
Get started right away on Azure, AWS, or Google Cloud—every Calico component you need to get up and running is ready to go.
Customer Testimonial
Here’s what our customers are saying about us

Thanks to Calico, we are now able to see exactly where things are happening in our environment, which allows us to identify potential security threats, monitor cluster health, and troubleshoot performance, connectivity, and security issues.

Featured Resources
Developer-created resources to help you secure your Kubernetes deployment
Blog
What’s New in Calico: Winter 2025
Introduction to the new Calico Dashboards including troubleshooting and policy testing use cases.



Ready to Get Started?
Get started for free or request a demo to see Calico in action