Kubernetes monitoring helps you identify issues and proactively manage Kubernetes clusters. Effective monitoring for Kubernetes clusters makes it easier to manage your containerized workloads, by tracking uptime, utilization of cluster resources (such as memory, CPU, and storage), and interaction between cluster components.
Kubernetes monitoring allows cluster administrators and users to monitor the cluster and identify issues such as insufficient resources, failures, pods that are unable to start, or nodes that cannot join the cluster. Many organizations use specialized cloud-native monitoring tools to gain full visibility over cluster activity.
This is part of an extensive series of guides about observability.
In this article, you will learn:
There are several things that are important to monitor in Kubernetes:
The following table summarizes important metrics for cluster and pod monitoring.
| Monitoring Level | Metrics | Description |
| Cluster | Nodes | Measures how many nodes are available and healthy, letting you determine the cloud resources you need to run the cluster. |
| Resource utilization | Measures the computing resources utilized by your nodes—including memory, CPU, bandwidth, and disk utilization. Understanding resource utilization helps inform decisions to decrease or increase the size or number of nodes in a cluster. | |
| Pod | Container metrics | Include network, CPU, and memory usage, compared with the prescribed maximum. These metrics can be accessed through metrics-server, which exposes the Metrics API. |
| Application metrics | These metrics are specific to the application and relate to its business logic. For example, a web application may provide metrics detailing the number of users accessing the application, user experience metrics, and conversion actions. | |
| Pod health and availability | Allow you to monitor how the orchestrator handles a specific pod. You can monitor for information such as the actual number of pod instances at a given moment compared to the expected number. These metrics also include health checks, network data, and on-progress deployment. |
Kubernetes is a complex environment, and containerized applications can be distributed across multiple environments. Monitoring solutions must be able to aggregate metrics from across the distributed environment, and deal with the ephemeral nature of containerized resources. The following are popular monitoring tools designed for a containerized environment.
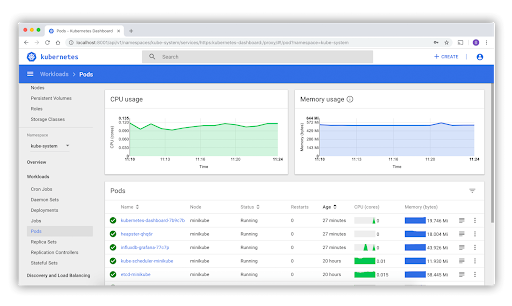
Kubernetes Dashboard is a web-based user interface for Kubernetes. You can use it to:
The Kubernetes dashboard will give you a bird’s eye view of what’s going on in your clusters, but it’s not enough for production monitoring. This requires a dedicated Kubernetes monitoring tool such as Prometheus.
A popular monitoring tool that was developed by SoundCloud before being donated to the Cloud Native Computing Foundation (CNCF), Prometheus provides alerts with detailed metrics and analysis for Kubernetes and Docker. It is designed for monitoring container-based microservices and applications running at scale. Prometheus is often used in combination with Grafana to enable data visualization.
Prometheus metrics are exposed through HTTP(S). There is no need to install a service agent. Instead, you can expose a web port. Prometheus servers regularly scrape (pull), eliminating the need to push metrics or configure remote endpoints. Prometheus uses a human-readable metrics format that is easy to understand, ensuring you can start publishing metrics quickly and easily.
Some microservices use HTTP for their functionality. In this case, you can reuse the internal web server and add a folder called /metrics. Some services expose Prometheus metrics from the ground up, such as the Traefik web proxy, the Kubernetes kubelet, and the Istio microservice mesh. Services that are not natively integrated can be adapted with an exporter, a service that collects service statistics and turns them into scrape-ready Prometheus metrics.
Prometheus can collect metrics related to various aspects, including Kubernetes services, orchestration status, and nodes. Here are common metrics exporters:
Prometheus uses PromQL to configure rules that trigger alerts, putting alertmanager in charge of configuring the receivers and gateways to deliver alert notifications and managing alert notification, inhibition, and grouping.
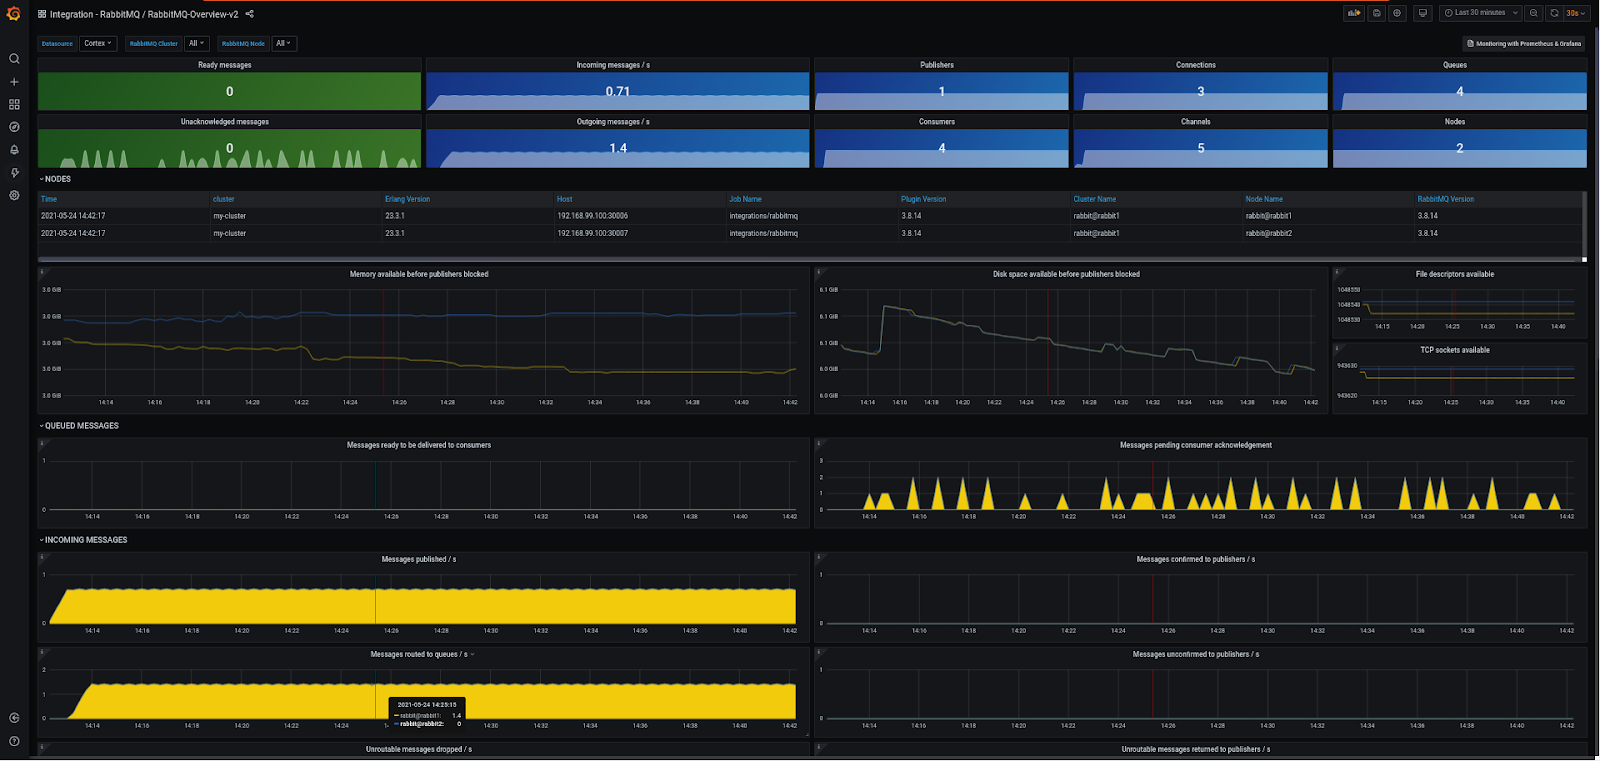
This open-source platform for visualization of metrics and analytics provides four built-in dashboards for Kubernetes—Cluster, Node, Pod/Container and Deployment. Kubernetes administrators can create data-rich dashboards in Grafana using the information sourced from Prometheus.
The EFK Stack integrates three tools—Elasticsearch, Fluentd, and Kibana—to collect, store, and visualize metric data. Elasticsearch is a search engine that ingests and stores data in a central repository, while Fluentd collects data from the logs of Kubernetes pods and routes it to Elasticsearch. Kibana is a plugin for Elasticsearch that functions as the UI for the EFK Stack, enabling the visualization of the logs and metrics in the form of custom dashboards.
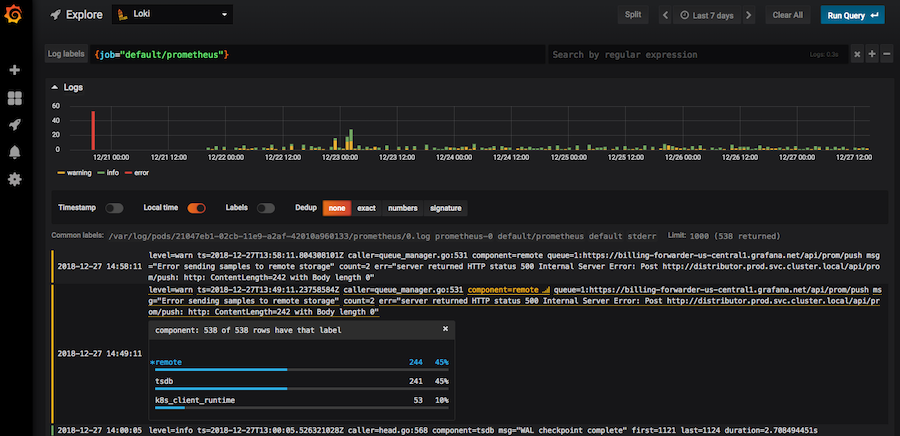
Grafana Loki is a log aggregator that facilitates monitoring in Kubernetes. It can work with Prometheus, share labels, and quickly correlate Kubernetes telemetry between these tools. Correlating Kubernetes metrics and logs can help quickly locate an issue’s root cause and eliminate the need to configure and manage different technologies.

Learn more in our detailed guide to Kubernetes monitoring tools
Here are several best practices that can help you effectively monitor and troubleshoot Kubernetes environments.
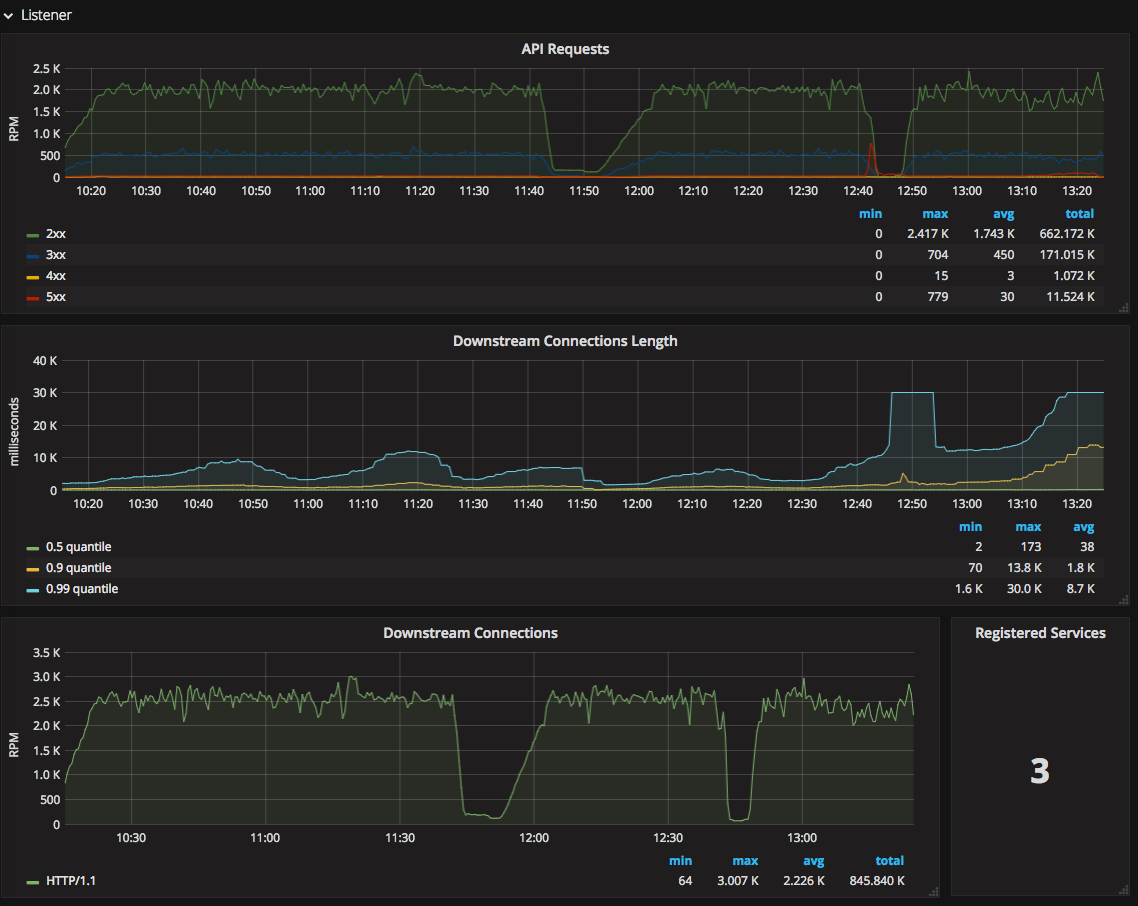
Granular resource metrics (memory, CPU, load, etc.) are important for identifying issues with Kubernetes microservices, but these metrics can be convoluted and difficult to use. The best KPIs to help you easily identify service issues are API metrics, such as request rate, call error, and latency. These metrics will quickly locate degradations in a component within a microservices application.
Having a single pane of glass for monitoring your Kubernetes metrics is a best practice because it allows you to view all of these metrics in a single, unified interface. This can make it easier to monitor and manage your cluster, as you can see all of the relevant metrics and data in one place, rather than having to switch between multiple tools and interfaces.
Having a single pane of glass for monitoring your Kubernetes metrics can also help you to identify trends and patterns in your data more easily. With all of your metrics in one place, you can see how different metrics are related and how they change over time, which can help you to identify potential issues and take action to address them.
Ensuring that monitoring systems are scalable allows you to monitor your Kubernetes cluster effectively, even as it grows and changes over time.
As your Kubernetes cluster grows, the amount of data that it generates will also increase, and your monitoring systems need to be able to handle this increase in data. If your systems are not scalable, they may become overwhelmed by the volume of data and may not be able to provide accurate or useful information.
In addition, having sufficient data retention is important because it allows you to retain and access historical data from your cluster. This can be useful for troubleshooting problems that occur, as well as for understanding trends and patterns in your cluster’s performance over time.
Data retention is also important for compliance because many regulatory frameworks, such as the General Data Protection Regulation (GDPR), require organizations to retain specific types of data for a certain period of time.
By generating the right alerts, you can identify potential problems with your Kubernetes cluster as soon as they occur, and take action to address them before they become more serious. For example, if you set up alerts for critical metrics, such as CPU or memory usage, you can be notified when those metrics reach certain thresholds, allowing you to take action before your cluster becomes overloaded.
Delivering alerts to the most appropriate staff members is also important because it ensures that the right people are notified when an issue arises. For example, if there is a problem with a specific deployment, you may want to notify the team responsible for that deployment, rather than sending the alert to everyone in your organization. By delivering alerts to the appropriate staff members, you can ensure that the right people are notified and can take action to address the issue.
Integrating Kubernetes monitoring systems with CI/CD pipelines allows you to monitor your applications and infrastructure as they are being deployed, rather than after they have been deployed.
By integrating your monitoring systems with your CI/CD pipeline, you can automatically collect and analyze metrics from your applications and infrastructure as they are being deployed. This can help you to identify potential issues early on, and take action to prevent them from becoming more serious.
In addition, integrating your monitoring systems with your CI/CD pipeline can also help you to automate deployment processes. For example, you can track specific metrics that indicate the success or failure of a deployment, and use these metrics to decide whether to automatically roll back a new release.
Because Kubernetes workloads are highly dynamic, ephemeral, and are deployed on a distributed and agile infrastructure, Kubernetes poses a unique set of monitoring and observability challenges. As such, Kubernetes-native monitoring and observability is required to monitor and troubleshoot communication issues between microservices in the Kubernetes cluster.
More specifically, context about microservices, pods, and namespaces is needed so that multiple teams can collaborate effectively to identify and resolve issues. Calico Cloud and Calico Enterprise help rapidly pinpoint and resolve performance, connectivity, and security policy issues between microservices running on Kubernetes clusters across the entire stack.
Calico Cloud and Calico Enterprise are currently the only Kubernetes monitoring tools that offer the following unique features for Kubernetes observability:
Learn more about Calico for Kubernetes monitoring and observability
Together with our content partners, we have authored in-depth guides on several other topics that can also be useful as you explore the world of observability.
Authored by Lumigo
Authored by Lumigo
Authored by Komodor