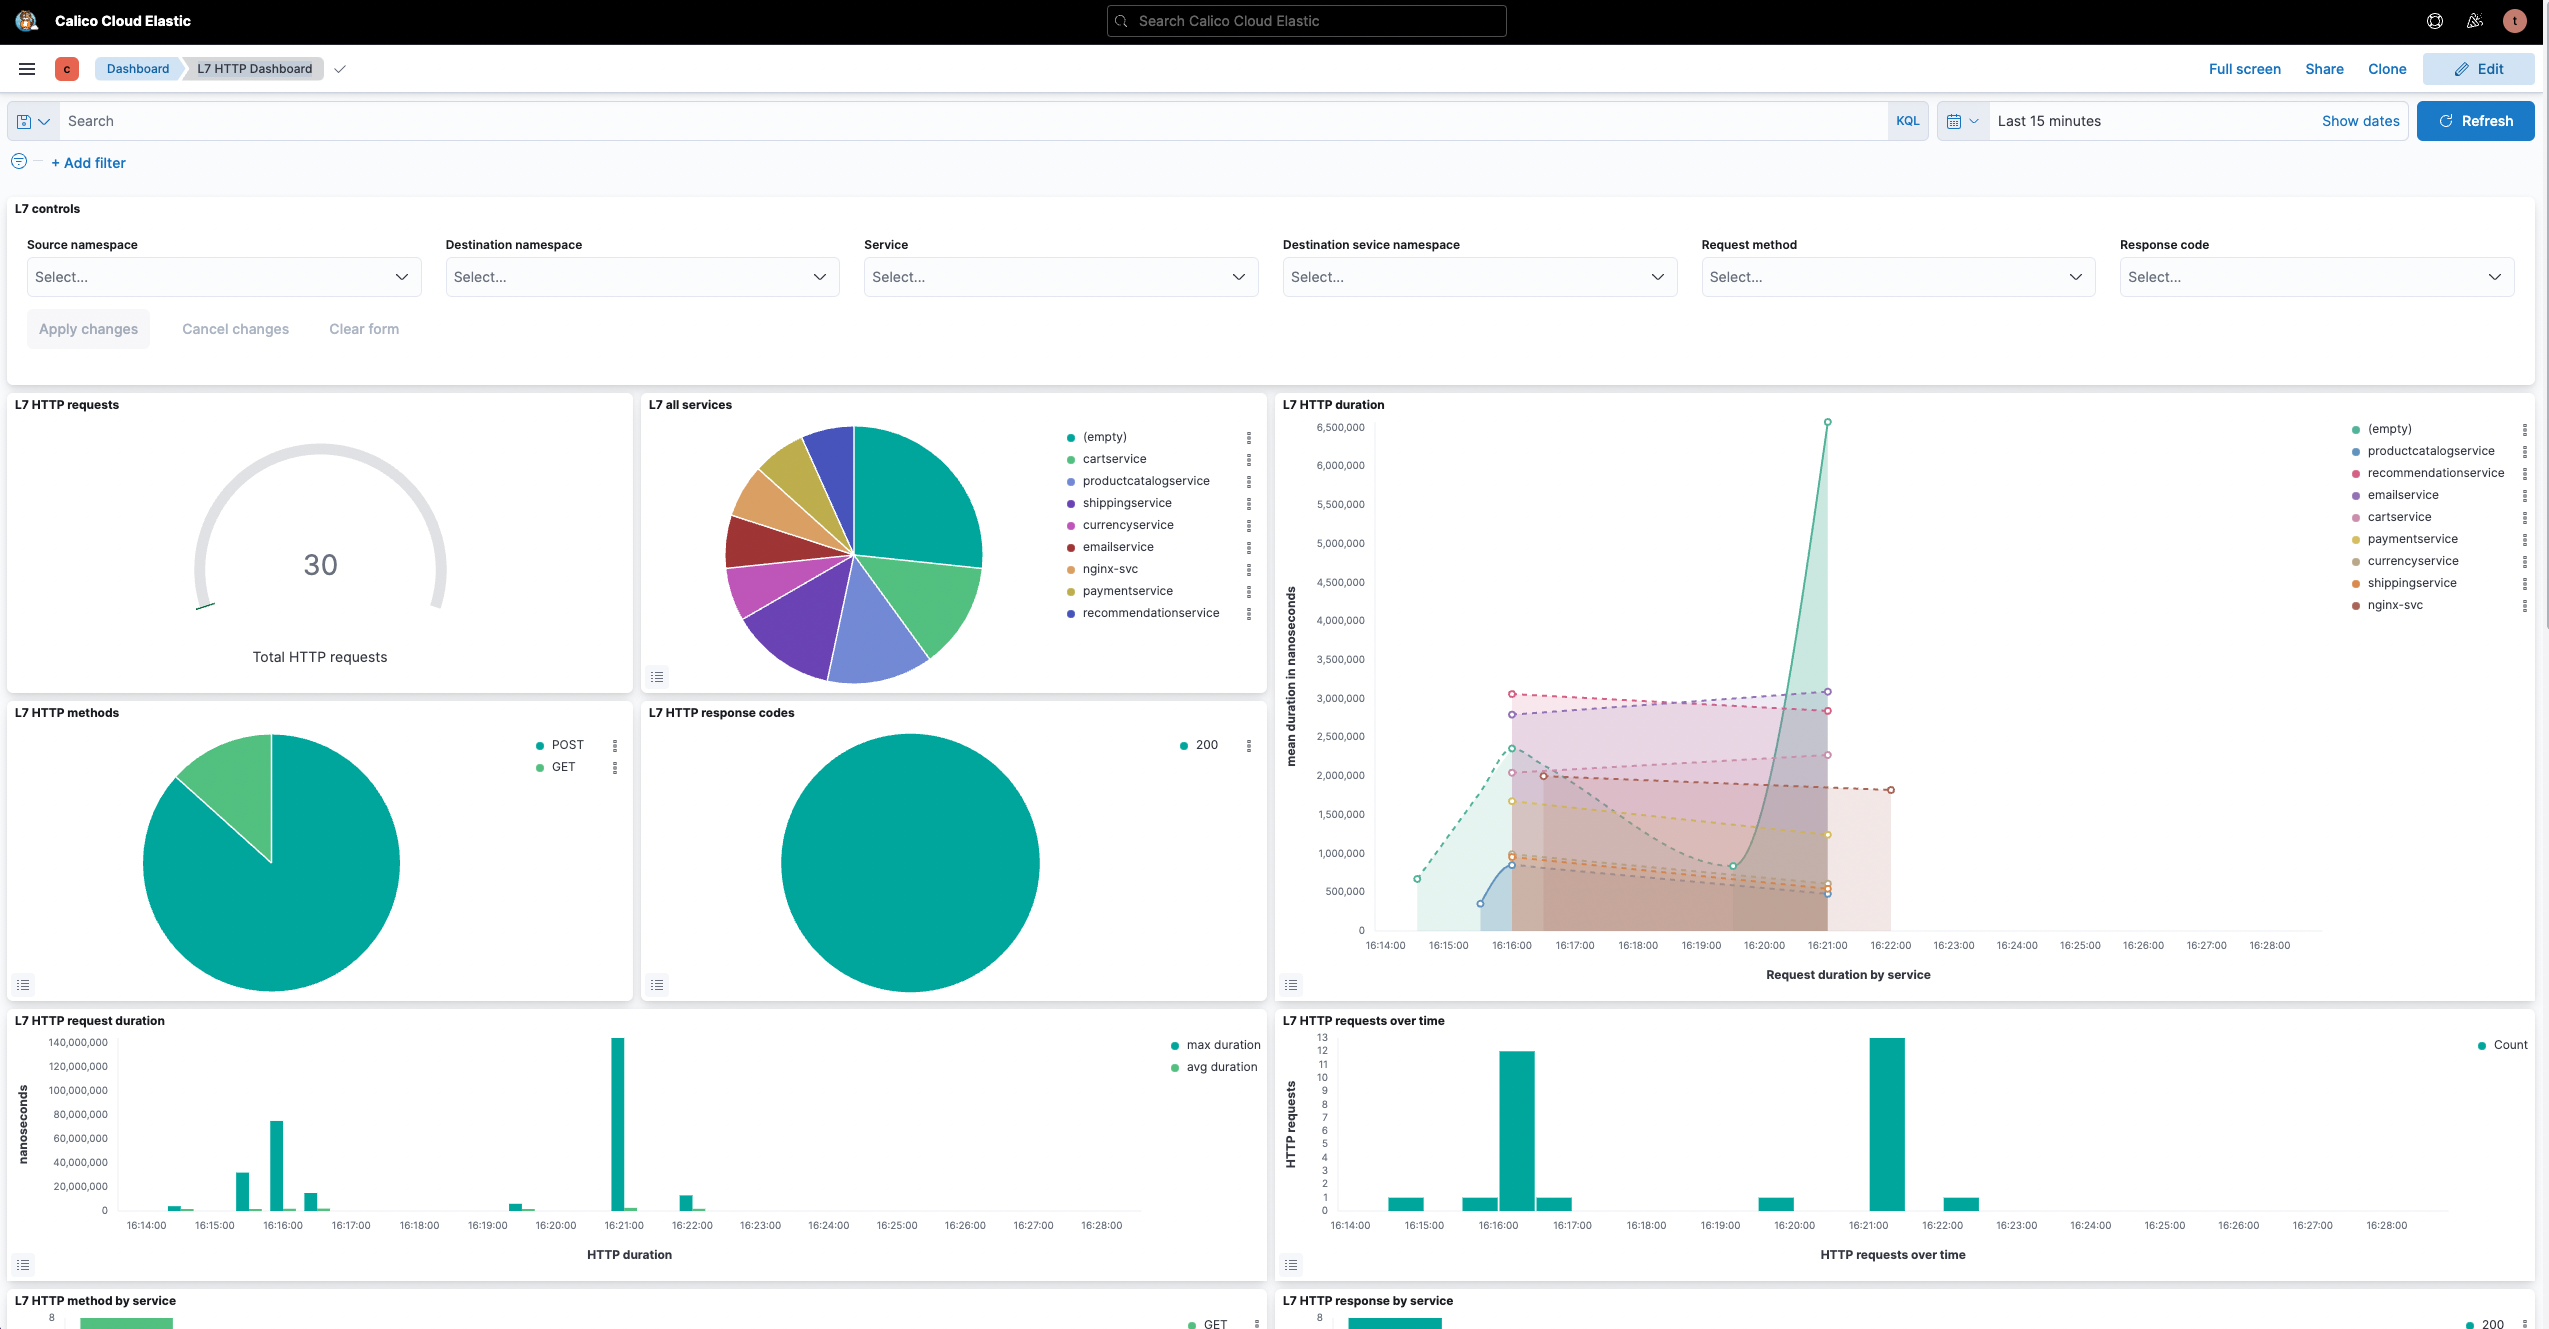
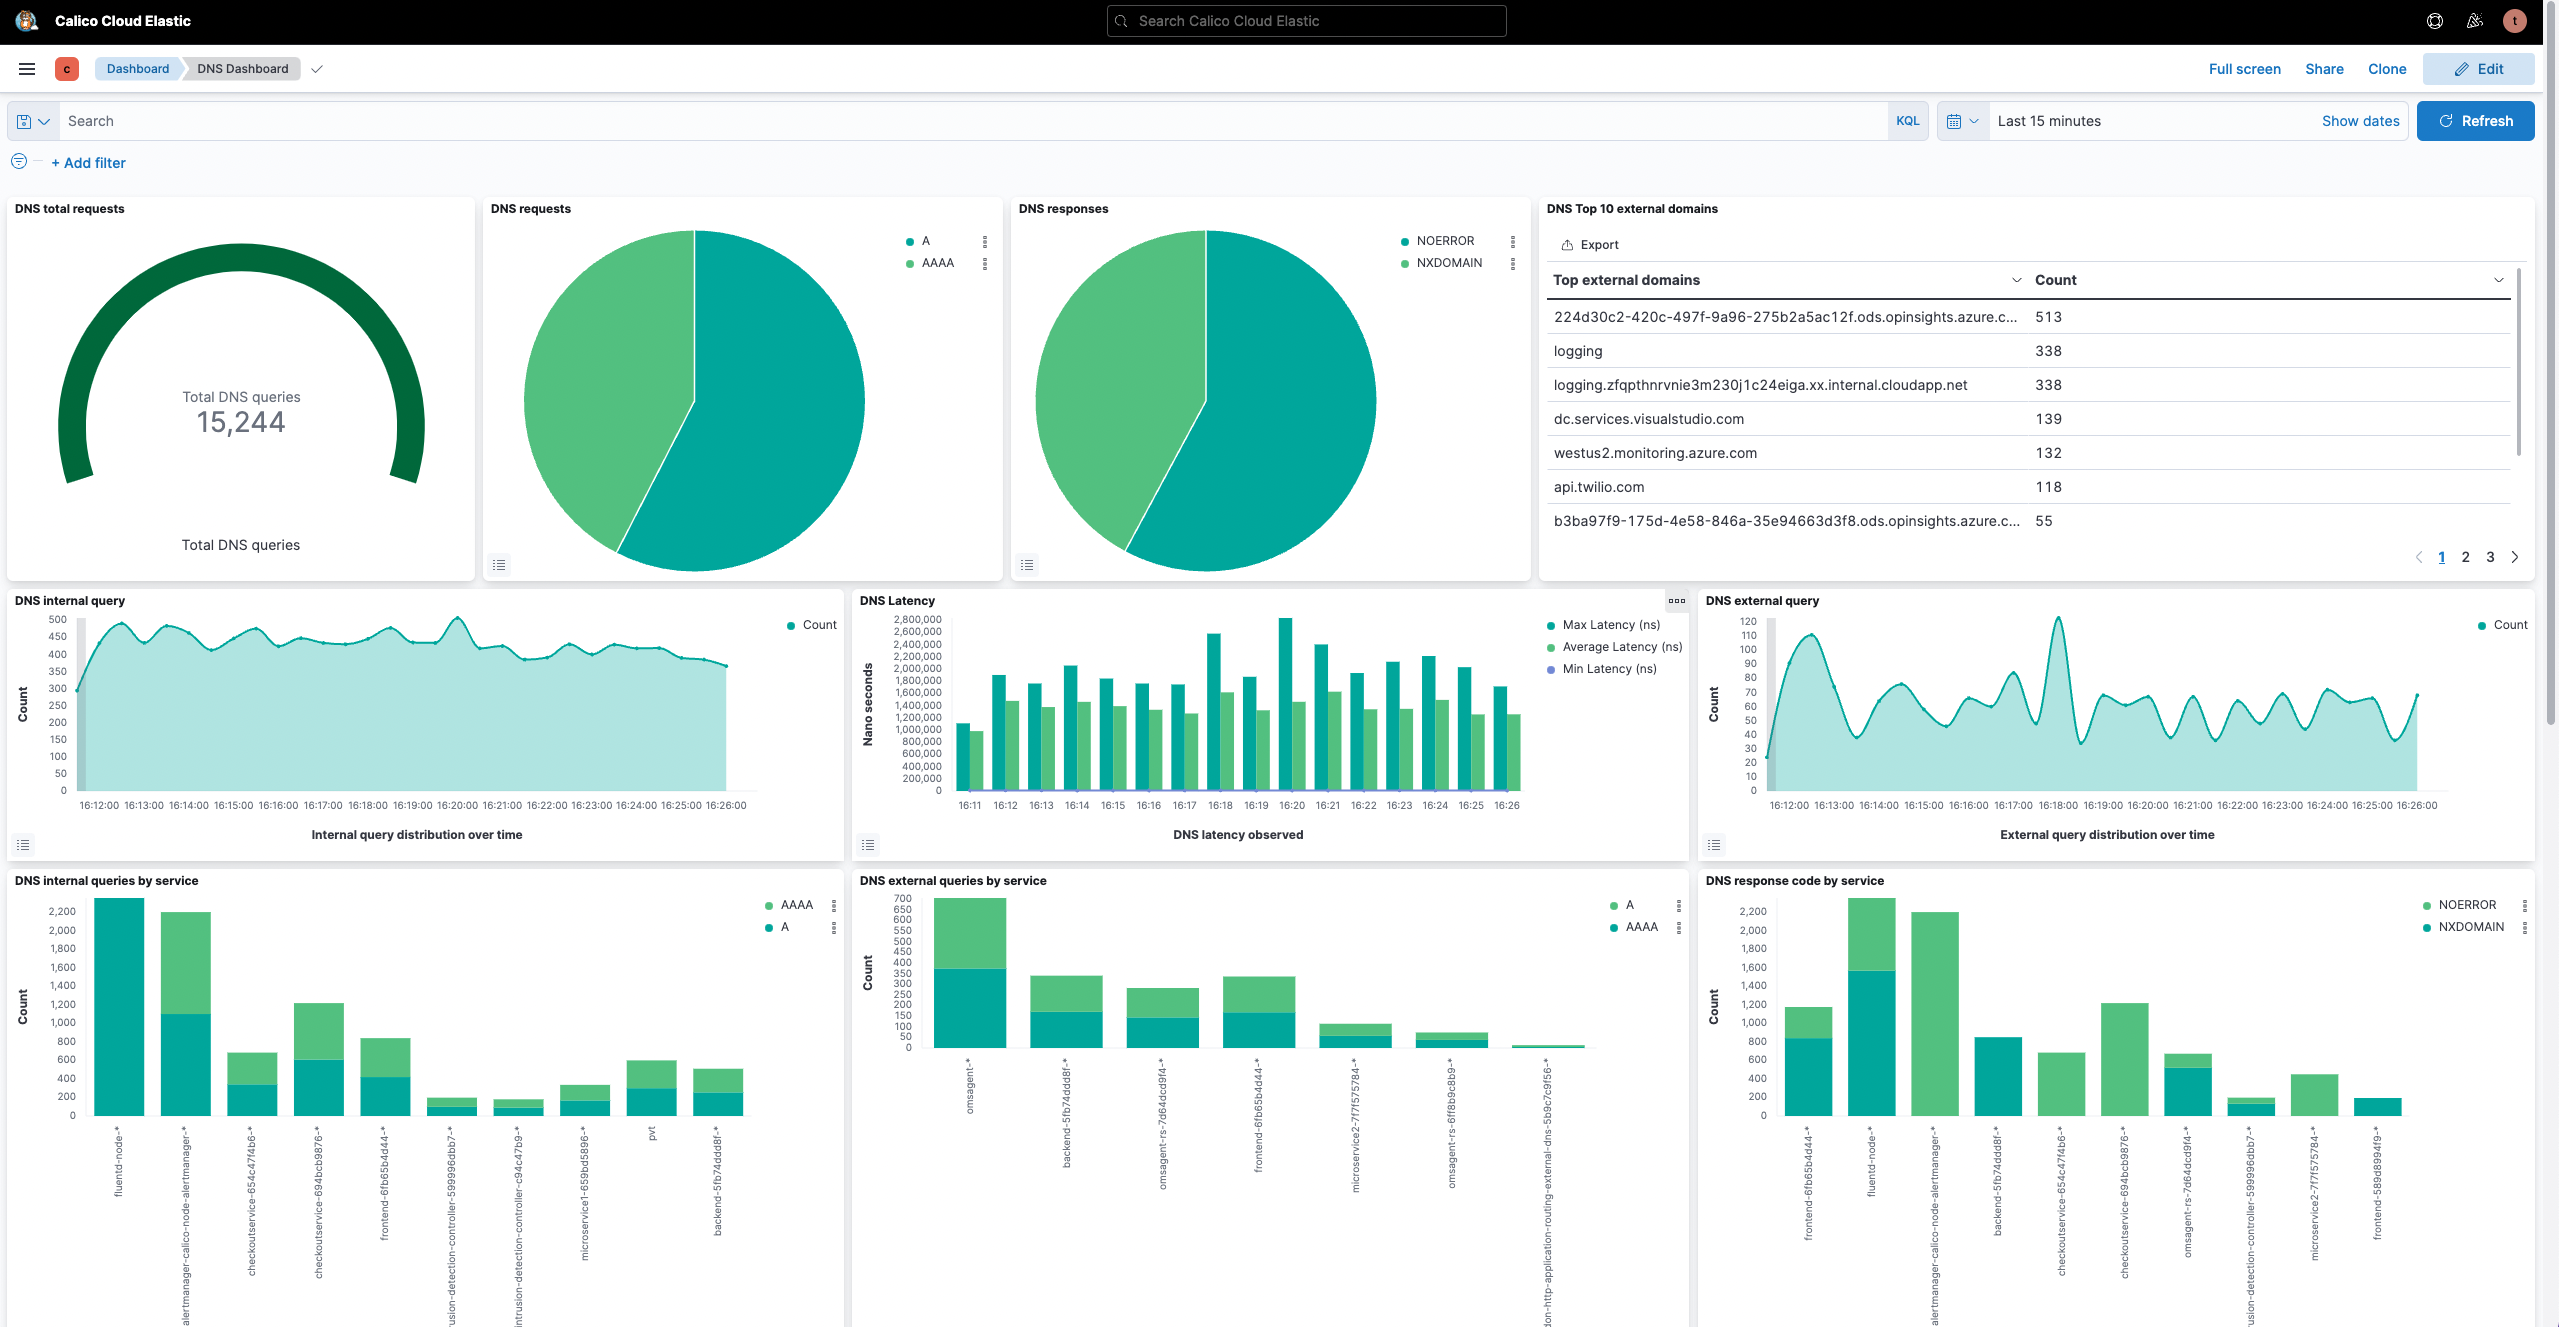
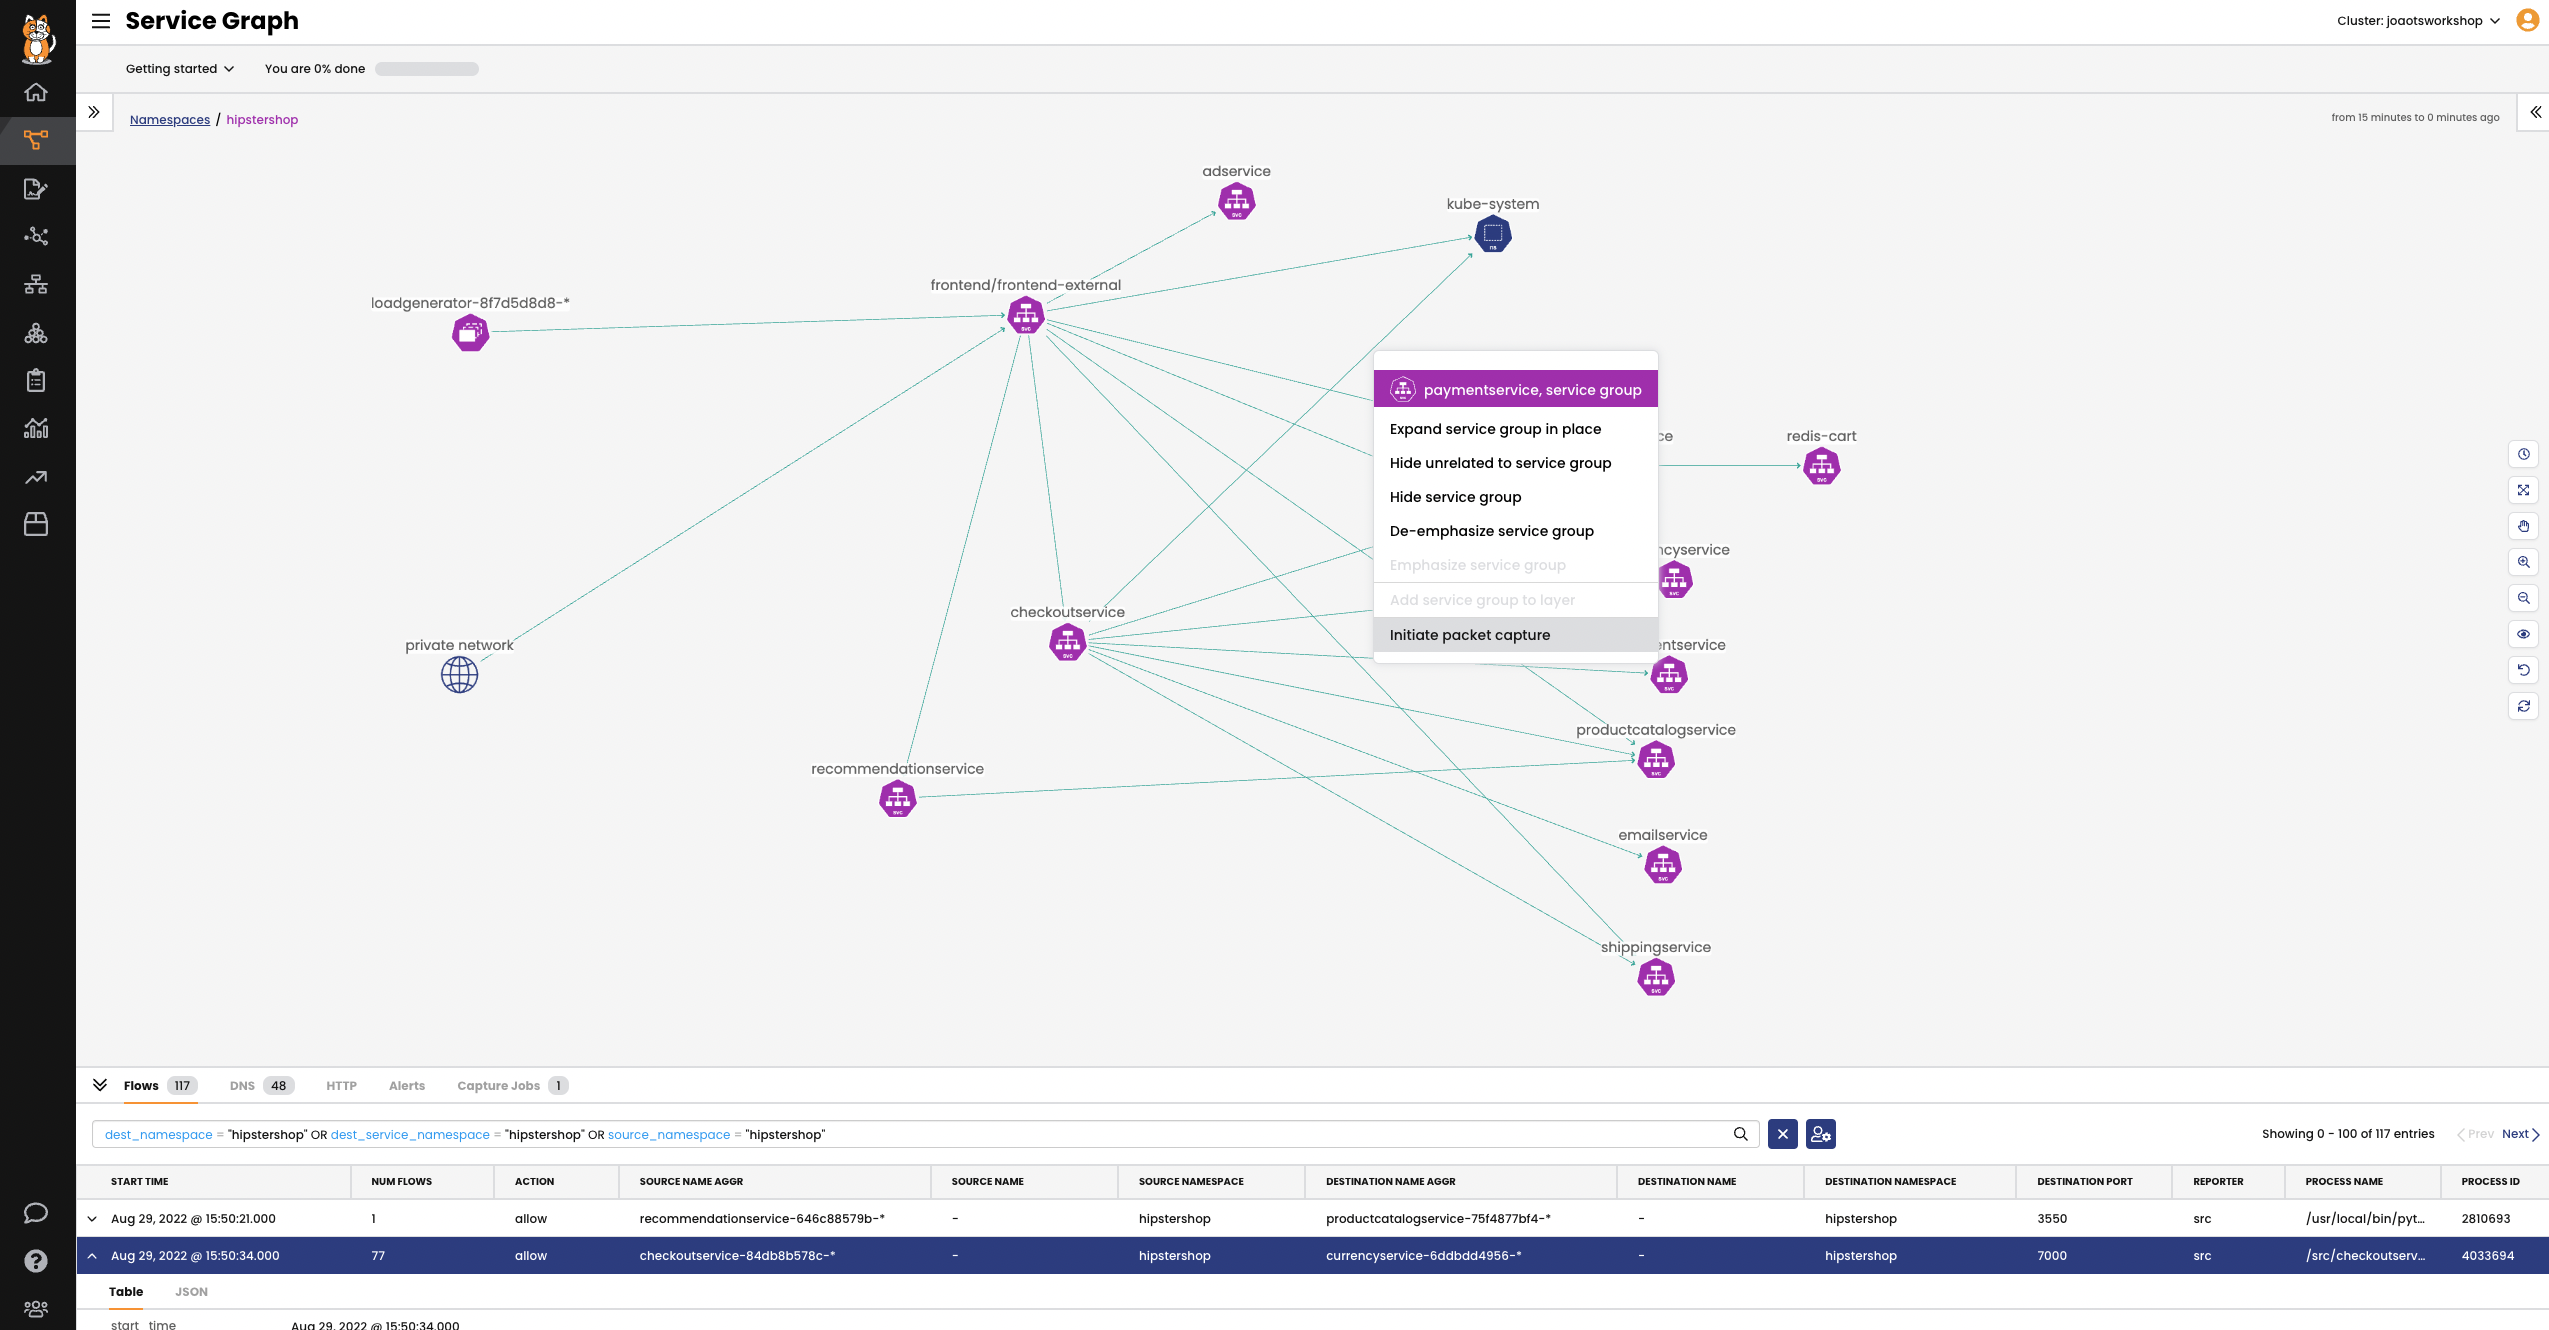
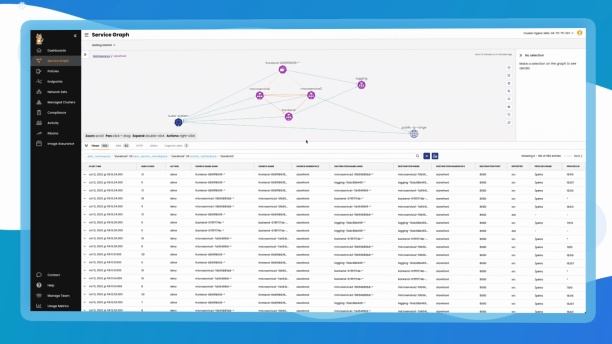
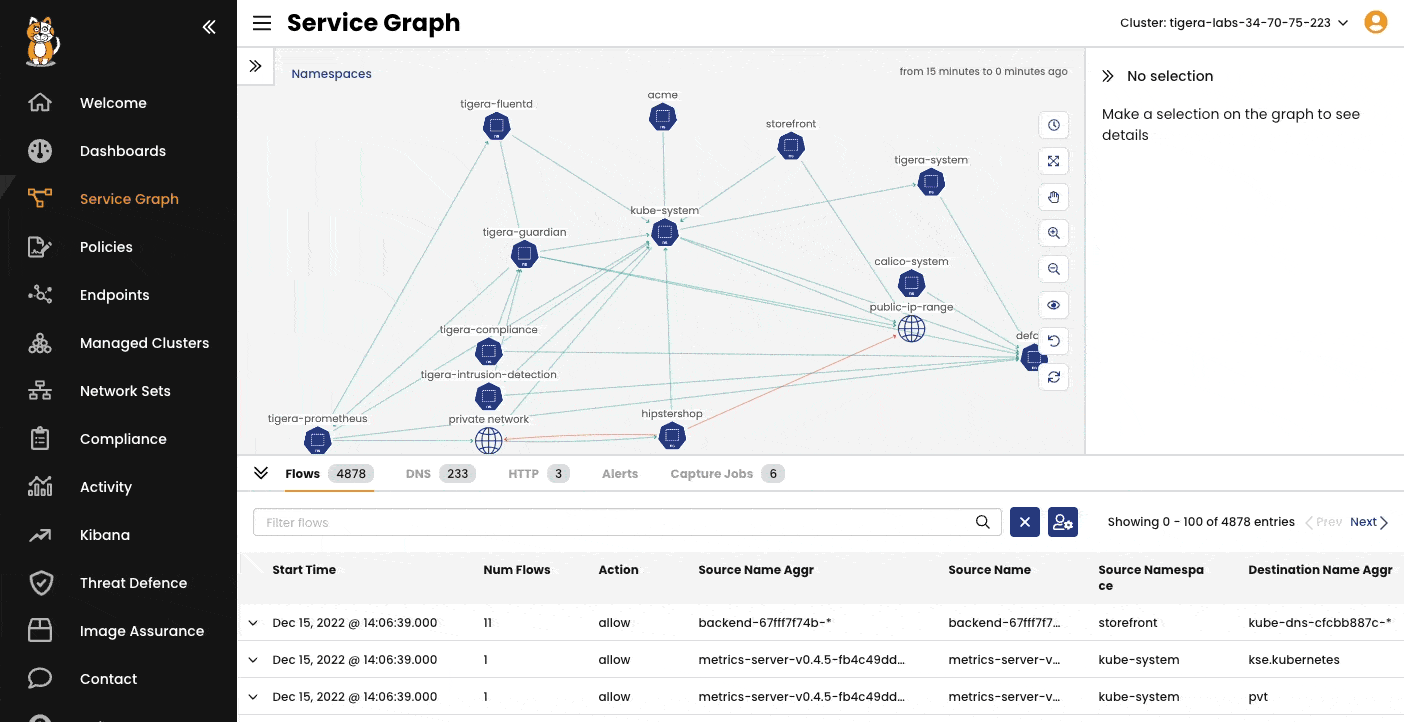
Full-stack observability powered by eBPF
Identify and resolve security and audit gaps, performance issues, connectivity breakdown, anomalous behavior, and security policy violations between namespaces, microservices, and pods in real time
Overview
Application developers, DevOps, and SREs often require better visibility of their different microservices, including what the upstream and downstream dependencies are, how services are interconnected, and what other clients, 3rd-party APIs, and applications access them.
Traditional monitoring solutions create data silos at each level and stitch them together to provide a snapshot view of interactions and dependencies. This approach is not scalable for a distributed application running in a Kubernetes environment given the high volume of granular data generated at each level and lifespan of each interaction, due to the underlying infrastructure and the ephemeral nature of workloads within Kubernetes.
Purpose-built observability is required to effectively monitor and troubleshoot communication issues between namespaces, microservices, and pods. Preserving the context around which namespaces, services, and pods are associated with this communication is needed for teams to effectively collaborate, efficiently identify and quickly resolve the issues.
Full-stack observability powered by eBPF significantly shortens the time to troubleshoot an application inside Kubernetes and plays a significant role in design decisions, workload placement, and resiliency.
Benefits
Full-stack observability powered by eBPF significantly shortens the time to troubleshoot an application inside Kubernetes and plays a significant role in design decisions, workload placement, and resiliency

Easy-to-consume application information in live, high-fidelity visualizations

Trend-based policy recommendations and preview

Tailored views of each level of environment with all relationship context intact

Faster troubleshooting to discover the root cause and ability to take corrective action in less than 5 clicks
Key Features

Dynamic Service and Threat Graph
The Dynamic Service and Threat Graph provides visibility across the stack from the network layer to the application layer, showing a runtime view of how namespaces, services, and pods are operating in your Kubernetes cluster. A point-to-point, topographical representation of traffic flow and security policy shows how workloads within the cluster are communicating, and across which namespaces.
The Dynamic Service and Threat Graph also includes advanced capabilities to filter resources, save views, share pre-built views, and troubleshoot application performance, communication, process, and DNS issues.

Dynamic Packet Capture
Dynamic Packet Capture is a self-service, on-demand tool for performing packet capture for a specific pod or collection of pods. It integrates with Kubernetes RBAC to limit and secure users’ access to the endpoints and namespaces assigned to them. It captures packets from a specific pod or collection of pods with specified packet sizes and duration, in order to troubleshoot performance hotspots and connectivity issues faster. You can utilize the existing label-based approach to target workloads’ in-network policies, in order to identify single or multiple workload endpoints for capturing live traffic.

DNS Dashboard
DNS Dashboard is an interactive UI with exclusive DNS metrics to help accelerate DNS-related troubleshooting and problem resolution in Kubernetes environments.
Quickly confirm or eliminate DNS as the root cause for microservice and application connectivity issues. The automated process removes the manual, time-consuming introspection typically required to correlate the data and pull it into a dashboard to visualize and troubleshoot issues.

Application-Level Observability
Detect anomalous behaviors like attempts to access applications and restricted URLs, and scans for particular URLs. Meet organizational/regulatory compliance requirements for application protection.
Get a centralized, all-encompassing view of service-to-service traffic in the Kubernetes cluster. Have a single pane of glass of all the application-layer traffic, broken down by service, response code, performance metrics, API calls, and application-level log data matched to networking-level data by default.
How It Works
Get a real-time view between different components, analyze traffic flows, build and deploy network and security policies, and quickly identify service-level connectivity issues that impact your services and troubleshoot them in real time with Calico Cloud and Calico Enterprise.