Service mesh provides a dedicated network for service-to-service communication in a transparent way. Istio aims to help developers and operators address service mesh features such as dynamic service discovery, mutual transport layer security (TLS), circuit breakers, rate limiting, and tracing. Jaeger with Istio augments monitoring and tracing of cloud-native apps on a distributed networking system. This article explains how to get started with Jaeger to build an Istio service mesh on the Kubernetes platform.
Spinning up a Kubernetes cluster
Minikube allows you to run a single-node Kubernetes cluster based on a virtual machine such as KVM, VirtualBox, or HyperKit on your local machine. Install Minikube and use the following shell script to run it:
#!/bin/bash

export MINIKUBE_PROFILE_NAME=istio-jaeger
minikube profile $MINIKUBE_PROFILE_NAME
minikube config set cpus 3
minikube config set memory 8192

# You need to replace appropriate VM driver on your local machine
minikube config set vm-driver hyperkit

minikube start
In the above script, replace the –vm-driver=xxxoption with the appropriate virtual machine driver on your operating system (OS).
Deploying Istio service mesh with Jaeger
Download the Istio installation file for your OS from the Istio release page. In the Istio package directory, you will find the Kubernetes installation YAML files in install/ and the sample applications in sample/. Use the following commands:
$ curl -L http://git.io/getLatestIstio | sh -
$ cd istio-1.0.5
$ export PATH=$PWD/bin:$PATH
The easiest way to deploy Istio with Jaeger on your Kubernetes cluster is to use Custom Resource Definitions. Install Istio with mutual TLS authentication between sidecars with these commands:
$ kubectl apply -f install/kubernetes/helm/istio/templates/crds.yaml
$ kubectl apply -f install/kubernetes/istio-demo-auth.yaml
Check if all pods of Istio on your Kubernetes cluster are deployed and running correctly by using the following command and review the output:
$ kubectl get pods -n istio-system
NAME                   READY  STATUS   RESTARTS AGE
grafana-59b8896965-p2vgs         1/1   Running  0     3h
istio-citadel-856f994c58-tk8kq      1/1   Running  0     3h
istio-cleanup-secrets-mq54t       0/1   Completed 0     3h
istio-egressgateway-5649fcf57-n5ql5   1/1   Running  0     3h
istio-galley-7665f65c9c-wx8k7      1/1   Running  0     3h
istio-grafana-post-install-nh5rw     0/1   Completed 0     3h
istio-ingressgateway-6755b9bbf6-4lf8m  1/1   Running  0     3h
istio-pilot-698959c67b-d2zgm       2/2   Running  0     3h
istio-policy-6fcb6d655f-lfkm5      2/2   Running  0     3h
istio-security-post-install-st5xc    0/1   Completed 0     3h
istio-sidecar-injector-768c79f7bf-9rjgm 1/1   Running  0     3h
istio-telemetry-664d896cf5-wwcfw     2/2   Running  0     3h
istio-tracing-6b994895fd-h6s9h      1/1   Running  0     3h
prometheus-76b7745b64-hzm27       1/1   Running  0     3h
servicegraph-5c4485945b-mk22d      1/1   Running  1     3h
Building sample microservice apps
You can use the Bookinfo app to learn about Istio’s features. Bookinfo consists of four microservice apps: productpage, details, reviews, and ratings deployed independently on Minikube. Each microservice will be deployed with an Envoy sidecar via Istio by using the following commands:
// Enable sidecar injection automatically
$ kubectl label namespace default istio-injection=enabled
$ kubectl apply -f samples/bookinfo/platform/kube/bookinfo.yaml

// Export the ingress IP, ports, and gateway URL
$ kubectl apply -f samples/bookinfo/networking/bookinfo-gateway.yaml

$ export INGRESS_PORT=$(kubectl -n istio-system get service istio-ingressgateway -o jsonpath='{.spec.ports[?(@.name=="http2")].nodePort}')
$ export SECURE_INGRESS_PORT=$(kubectl -n istio-system get service istio-ingressgateway -o jsonpath='{.spec.ports[?(@.name=="https")].nodePort}')
$ export INGRESS_HOST=$(minikube ip)

$ export GATEWAY_URL=$INGRESS_HOST:$INGRESS_PORT
Accessing the Jaeger dashboard
To view tracing information for each HTTP request, create some traffic by running the following commands at the command line:
$ while true; do
 curl -s http://${GATEWAY_URL}/productpage > /dev/null
 echo -n .;
 sleep 0.2
done
You can access the Jaeger dashboard through a web browser with http://localhost:16686 if you set up port forwarding as follows:
kubectl port-forward -n istio-system $(kubectl get pod -n istio-system -l app=jaeger -o jsonpath='{.items[0].metadata.name}') 16686:16686 &
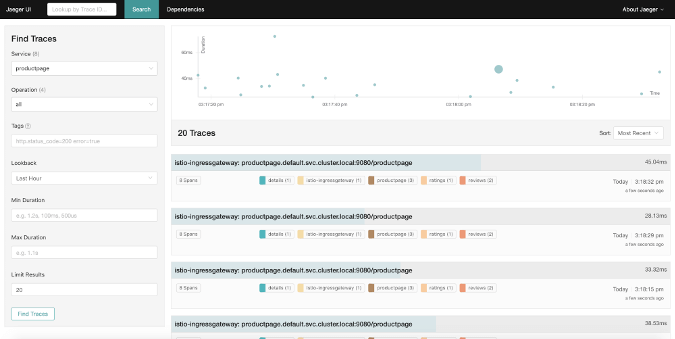
You can explore all traces by clicking “Find Traces” after selecting the productpage service. Your dashboard will look similar to this:
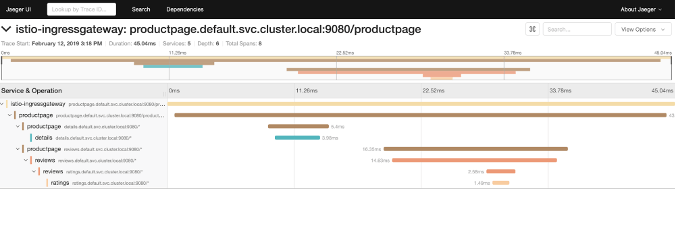
You can also view more details about each trace to dig into performance issues or elapsed time by clicking on a certain trace.
Conclusion
A distributed tracing platform allows you to understand what happened from service to service for individual ingress/egress traffic. Istio sends individual trace information automatically to Jaeger, the distributed tracing platform, even if your modern applications aren’t aware of Jaeger at all. In the end, this capability helps developers and operators do troubleshooting easier and quicker at scale.
This article is published originally at http://opensource.com/article/19/3/getting-started-jaeger
This article originated from http://www.linkedin.com/pulse/getting-started-jaeger-build-istio-service-mesh-daniel-oh/
————————————————-
Free Online Training
Access Live and On-Demand Kubernetes Tutorials
Calico Enterprise – Free Trial
Solve Common Kubernetes Roadblocks and Advance Your Enterprise Adoption