The network is foundational to distributed application environments. A distributed application has multiple microservices, each running in a set of pods often located on different nodes. Problem areas in a distributed application can be in network layer connectivity (think network flow logs), or application resources unavailability (think metrics), or component unavailability (think tracing). Network layer connectivity can be impacted by various factors such as routing configuration, IP pool configuration, network policies, etc. When service A cannot talk to service B over the network, or an external application cannot connect to service A, network logs become an essential source of historical data needed for troubleshooting connectivity issues. Just like in a traditional network, network logs enable cluster administrators to monitor the Kubernetes microservices network.
Network Logs Can Address Multiple Use Cases
Network logs can be used to serve the unique requirements of different teams (DevOps, SecOps, Platform, Network). The value of Kubernetes network logs resides in the information collected, such as detailed context about endpoints (e.g., pods, labels, namespaces) and the network policies deployed in configuring the connection. Within the IT estate, DevOps, SecOps, Network and Platform teams can use network logs to address use cases that apply within their respective domains. We’ve shown some examples, below.

Generate Policies and Detect Threats with Calico Enterprise Flow Logs
Calico Enterprise generates context-aware network flow logs for every connection to a pod. The flow log is captured on a file on the node, which is then processed by a fluentd agent and sent to the configured destination.
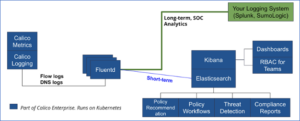
As shown in the diagram above, logs are sent by default to an Elasticsearch engine, which is included with Calico Enterprise. You can configure flow logs to be forwarded to your SOC platform. We recommend you have a single logging platform for all your logs. Logs are a critical monitoring and analytical tool for the operations team who already has well-defined processes built around a centralized logging platform. This is important for your planning.
Flow Log Characteristics
Flow logs have a lot of storage overhead. By default, Calico Enterprise keeps only seven days of logs. This enables Calico Enterprise to provide features specifically targeted for simplifying policy development, and troubleshooting connectivity in near real-time.
- Policy recommendation enables developers to automatically generate network policies to harden their service
- Policy workflow (recommendation, preview, staged policies) enables SecOps and DevOps to build policies efficiently and deploy in a non-intrusive manner
- Threat detection enables SecOps to investigate every flow log by specific IP or domain, and detect threats
A typical flow log in Calico Enterprise is enriched with all the required contextual information as follows:
- Kubernetes context (pod, namespace, labels, policies)
- Original IP for external sources, if available through ingress
- Start_time, end_time, action, bytes_in, bytes_out, dest_ip, dest_name, dest_name_aggr, dest_namespace, dest_port, dest_type, dest_labels, reporter, num_flows, num_flows_completed, num_flows_started, http_requests_allowed_in, http_requests_denied_in, packets_in, packets_out, proto, policies, source_ip, source_name, source_name_aggr, source_namespace, source_port, source_type, source_labels, original_source_ips, num_original_source_ips
A DNS log is aggregated per pod over time, and contains the following information:
- Start_time, end_time, type, count, client_ip, client_name, client_name_aggr, client_namespace, client_labels, qname, qtype, qclass, rcode, rrsets, servers
The log entries described are available through Kibana as Elasticsearch indexes. You have full control of the indexing, retention and storage parameters. Sticking to defaults works well for most deployments.
Reduce Operational Costs by Optimizing Flow Log Storage
Calico Enterprise collects various logs (network/flow, audit, DNS). Out of all these, flow logs are the most expensive in terms of storage, consuming over 95% of overall storage. It is not unusual to see 5k flows/sec per fully-loaded node. With a modest 200 bytes/flow, this translates to 1 MB/s (megabyte). The daily storage requirement per node is 86GB for flow logs. For a 100-node cluster, the daily flow log requirement becomes 8TB+!! Clearly, it doesn’t scale. And more importantly, do you really need to retain so much data? Typically, the value of log data decreases exponentially over time and is relevant only for troubleshooting and compliance purposes.
For that reason, Calico Enterprise has a default configuration aggregation that intelligently reduces flow log storage requirements by over 100x! We do this without sacrificing the value (visibility, monitoring, troubleshooting) that our customers get out of flow logs. Logs for a destination replicaset are aggregated on a particular port over a period of time. So you don’t need to worry about the cost of storing flow logs while using the default Calico Enterprise configuration. Another way Calico Enterprise can help you to reduce storage requirements is by exclusion. You can easily configure specific namespaces or deployments to be excluded from generating flow logs.
Interested in exploring flow logs in detail?
Flow logs are enabled by default. Refer to the following documentation for custom configuration.
- Flow logs format
- DNS logs format
- Exclude specific namespace of pod
- Log retention period
- Additional logging destination
————————————————-
Free Online Training
Access Live and On-Demand Kubernetes Training
Calico Enterprise – Free Trial
Network Security, Monitoring, and Troubleshooting
for Microservices Running on Kubernetes
Join our mailing list
Get updates on blog posts, workshops, certification programs, new releases, and more!