







System observability
System observability is an essential part of identifying performance issues within your environment because it provides a comprehensive view of how your systems are operating at a glance. Typically, observability is achieved through the collection and analysis of metrics. These metrics, generated by your applications, are deliberately incorporated by developers into the source code to offer insights into the application’s internal processes. By monitoring these metrics, you can understand the application’s behavior, quickly detect anomalies and pinpoint areas that may require optimization. This proactive monitoring helps ensure that your system remains robust and reliable.
Calico observability metrics
Calico Open Source offers many observability metrics. These metrics can be used to generate health reports and insights into the inner workings of your cluster. There are also logs that key components such as Felix (the brain of Calico), and Typha output that can be used to pinpoint a range of actions and their durations, such as configuration delays, data plane changes, policy syncs, route changes, etc.
Continuous application profiling
In this blog post, we will explore how continuous application profiling can help you solve complex issues and be a great addition to your observability suite. This technique provides deep insights into your applications’ performance characteristics, allowing you to identify and resolve inefficiencies at a granular level.
By the end of this post, you will be able to enable profiling in your environment for Calico or any other applications via native or eBPF-based probes. Additionally, you will learn how to integrate continuous profiling with Grafana Pyroscope to generate comprehensive reports and visualize profiling reports.
This post also showcases a new feature of Calico 3.28: the ability to run and interact with a profiling server via applications such as Pyroscope or Go command-line tools.
What is continuous profiling and why do I need it?
Continuous profiling collects detailed samples of data about how applications are using system resources at a very granular level. Unlike traditional profiling, which is often done in short bursts or in a controlled environment, continuous profiling runs in production environments and provides ongoing insights into application behavior and performance.
Continuous profiling helps you pinpoint exactly where your application is spending its resources, allowing you to identify and address performance bottlenecks. It also helps you make informed decisions about scaling your infrastructure, ensuring that you allocate resources where they are needed the most. Continuous profiling will give you a complete picture of your system, application, and service’s performance when combined with metrics, logs, and traces.
To better understand profiling, let’s talk about the ways that we can gather these profiling data from our applications or system.
There are two main ways that we are going to examine in this blog to achieve profiling:
- eBPF-based profiling
- Native profiling
eBPF-based profiling
Currently, in Linux, you can use eBPF programs to generate profiles and traces for a specific application or your cluster and all of its applications. The best part about this method of profiling is that it doesn’t require any changes to your application and can be done transparently with a low overhead. However, eBPF-based profiling is limited in some cases.
For example, the level of detail can be limited depending on the application’s programming language. This method also doesn’t fully oversee the application’s memory usage or runtime garbage collection, and it requires a privileged user to run some of the eBPF programs.
Native profiling
Most programming languages offer profiling libraries and hooks that can be integrated into an application. These libraries allow the developer to expose an API to generate real-time profiling samples.
Profiling is not just an answer for performance tuning; developers and administrators can also use it. In complex cases, examining these profiling reports of CPU and Memory usage on your own or sharing them on a GitHub issue with the project maintainers can help quickly solve these issues.
Note: From 3.28 onward, Calico will be shipped with native profiling capabilities, allowing you to integrate this information with applications such as Pyroscope to generate detailed reports of your Calico component resource usage.
Profiling overhead
At this point, you might be wondering about the impact of profiling on your system. Since profiling data is captured at regular intervals, it has a tiny impact on your system, allowing it to be run in a production environment. On top of that, you could always adjust this interval to allow more time between each sampling period for a busy environment.
How to enable profiling
Calico 3.28 offers native profiling capabilities via the Go pprof library. Similar to Prometheus metrics, the profiling server is disabled by default.
Note: The commands in this blog post assume that you have a running Kubernetes cluster equipped with Calico and Helm. If you need help creating such an environment, please click here.
Use the following command to enable the profiling server:
kubectl patch felixconfiguration default --type=merge -p='{"spec":{"debugPort":9096}}'Important Security Note: Default Profiling Server Configuration
Remember that by default, the Calico debugging host only responds to requests from the localhost – a critical security decision that prevents others from querying the performance server. This ensures that your profiling data remains private and secure. However, if you need to allow remote access to your profiling server, you can modify its behavior using the following command:
kubectl patch felixconfiguration default --type=merge -p='{"spec":{"debugHost":"0.0.0.0"}}'To enable remote access, simply execute the command above, which will allow your profiling server to respond to requests from any origin. Please note that this change opens up your server to potential security risks, so it’s essential to implement Calico network security policies and host endpoints to protect your server from unauthorized access. To ensure the secure operation of your profiling server, we recommend familiarizing yourself with our guide on host endpoint and policy design. This will help you create a robust security framework that protects your data and system.
You should be able to open the Calico pprof server using your node IP address and debugport.
Note: To view the debug server you should navigate to http://<YOUR_NODE_IP>:9096/debug/pprof/.
You should see a page similar to the following image. Each hyperlink on this page will give you detailed information about a part of Calico.

Developer note: This URL is also compatible with the go tools pprof subcommand and can help you understand the profile information more easily.
Grafana Pyroscope
Pyroscope is an open-source continuous profiling tool designed to help developers understand and improve the performance of their applications by collecting and visualizing profiling data. It enables users to visualize profiling data (such as CPU, memory, and other resource usage).
Installing Pyroscope
Use the following commands to add the Grafana repository to your helm:
helm repo add grafana https://grafana.github.io/helm-charts
helm repo update
Use the following command to install Pyroscope via Helm:
helm install pyroscope grafana/pyroscope --create-namespace --namespace calico-monitoringUse the following command to port-forward the pyroscope web-ui, allowing you to access the Pyroscope dashboard from a browser:
kubectl port-forward --namespace calico-monitoring svc/pyroscope 4040:4040Using your browser, you should be able to see the following website at localhost:4040.
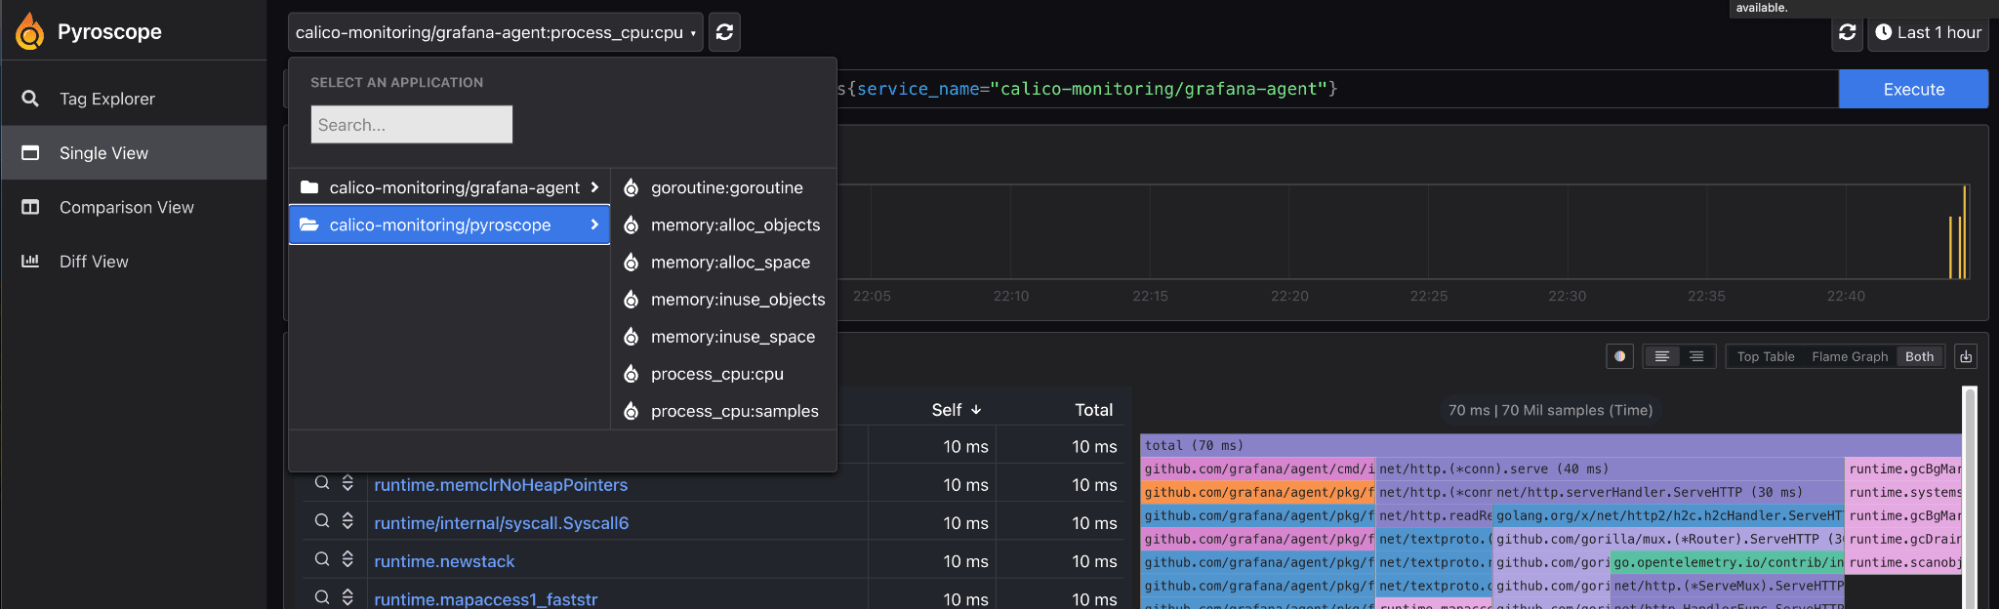
The following image illustrates the Pyroscope dashboard:
Scraping profile information
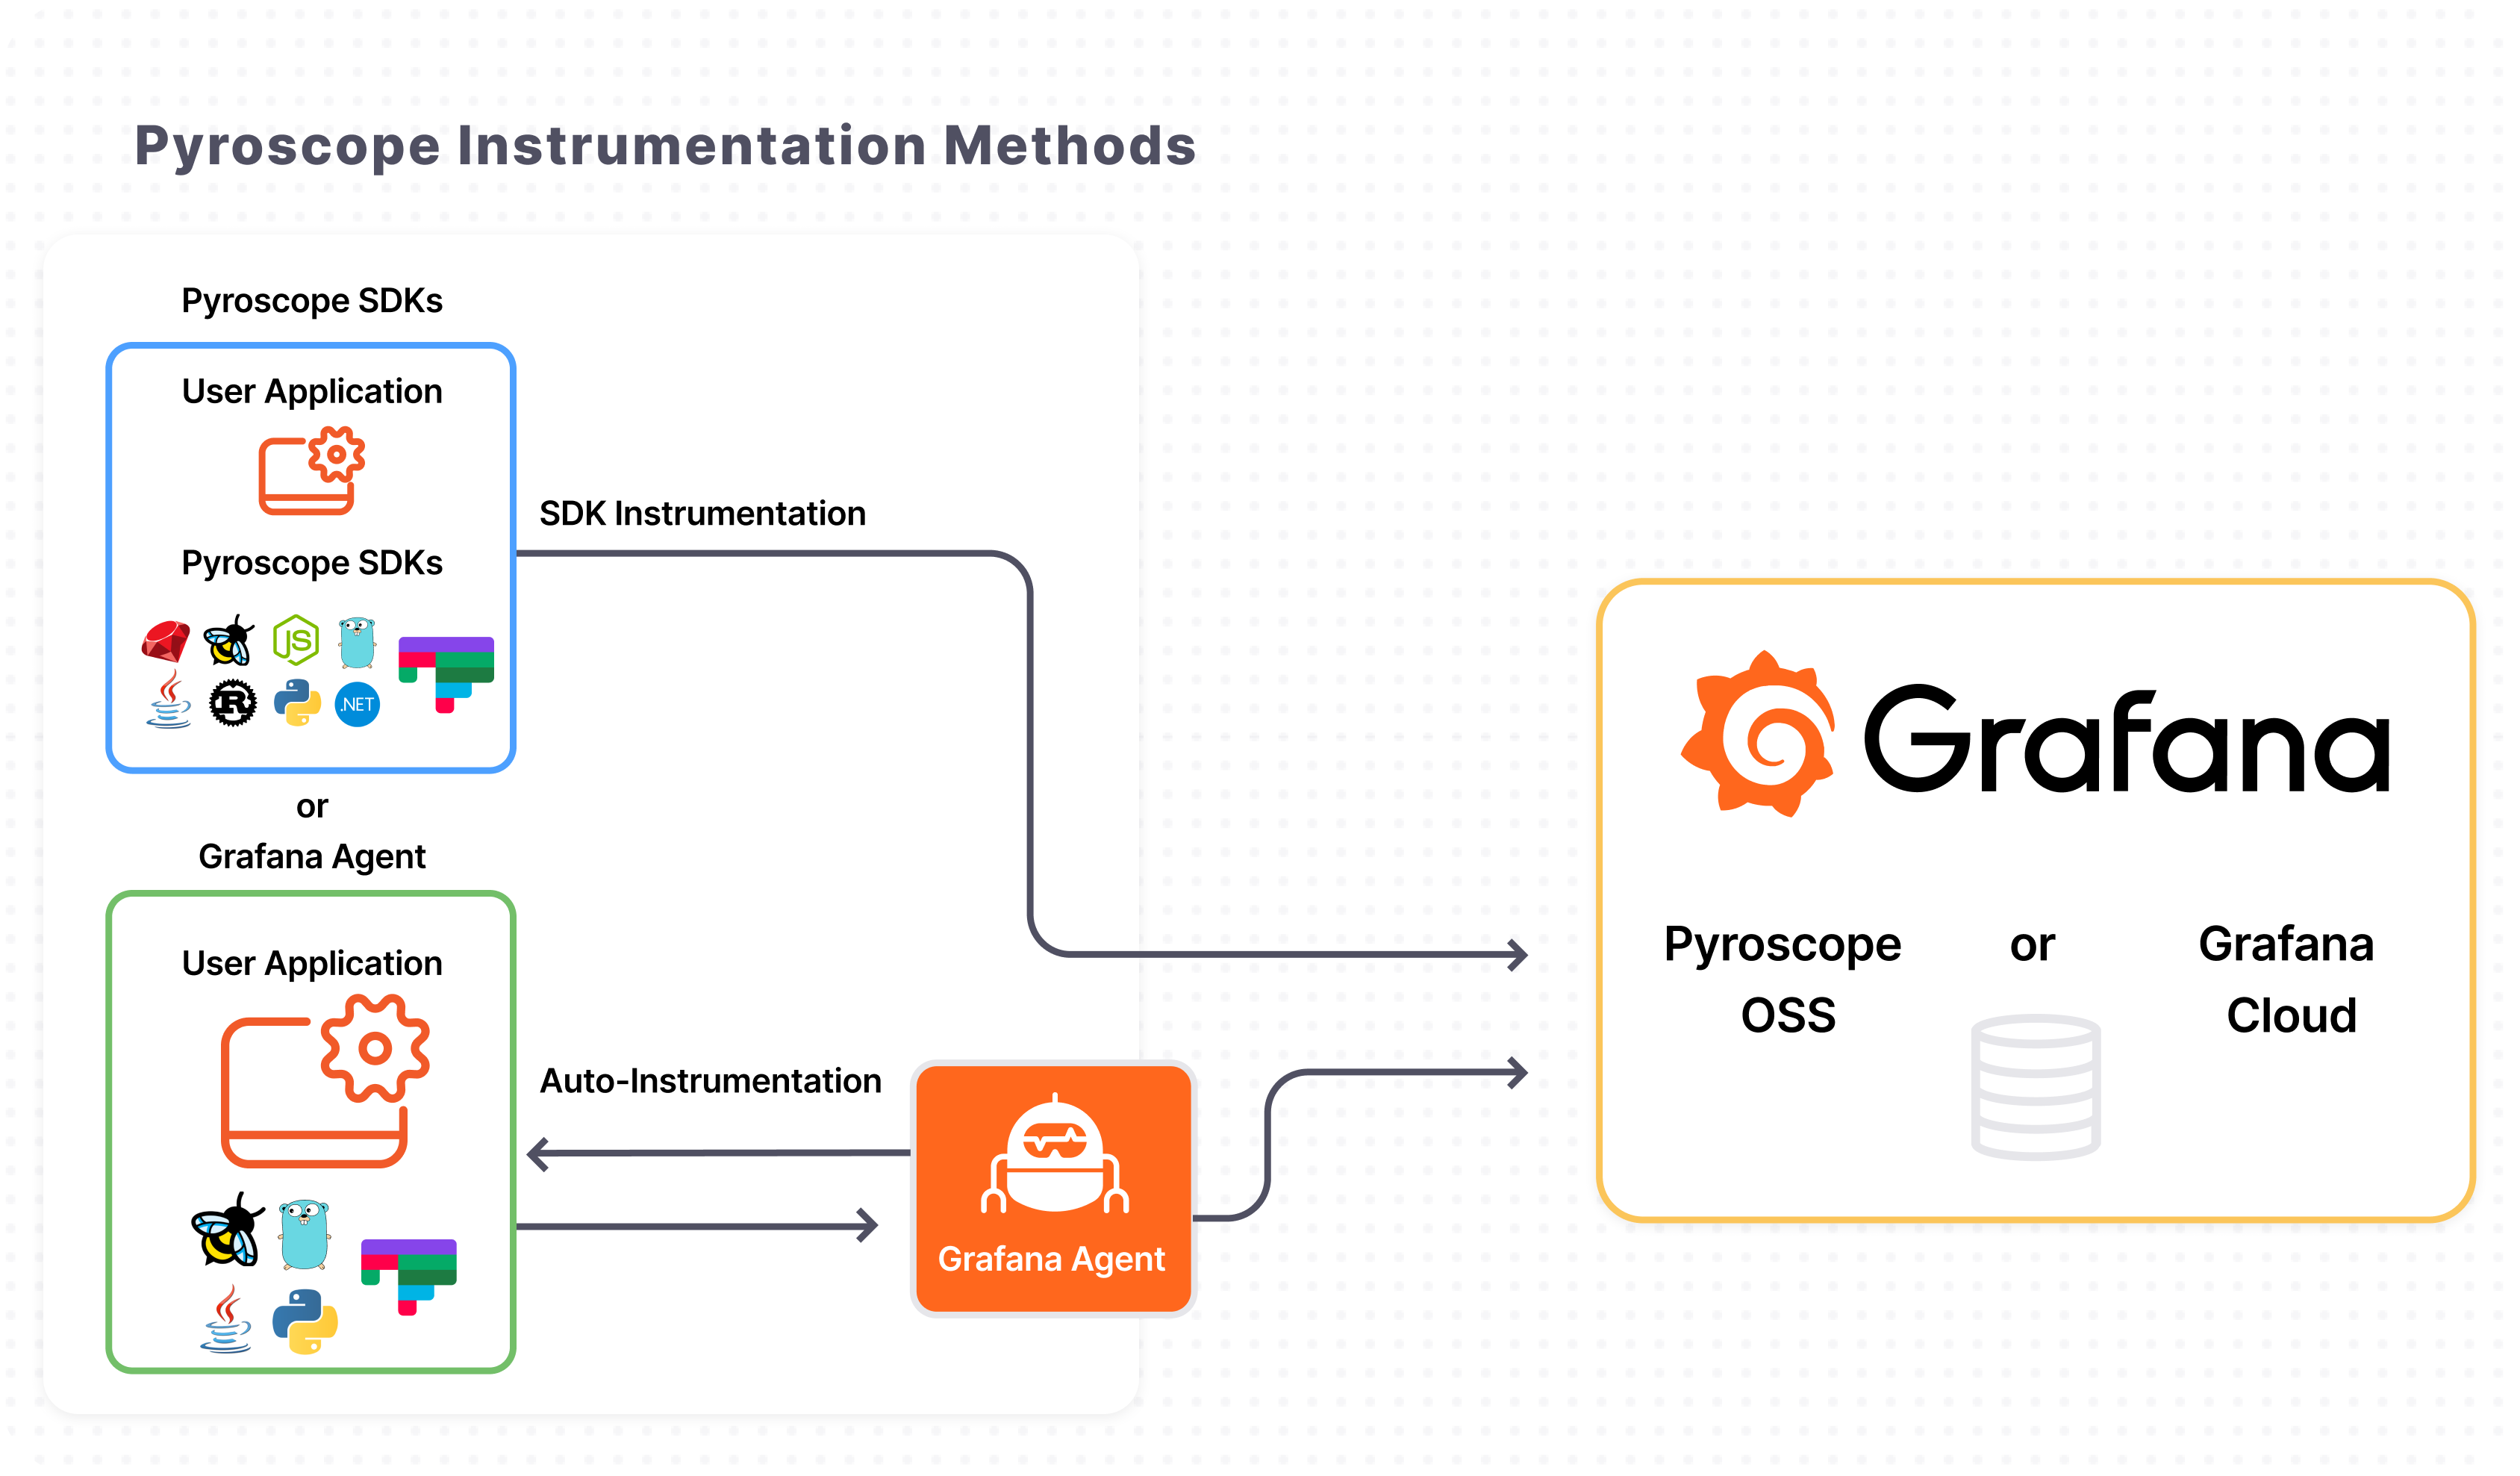
By default, Pyroscope monitors its own agent and installation. It also accepts input from applications that are integrated with the Pyroscope SDK (push method) or Grafana agent (pull method).

Image source: Grafana
Grafana-agent can scrape multiple profiling libraries such as go pprof. To do this, we need to specify a pyroscope.scrape block in our agent configuration and point it the the appropriate targets.
Use the following command to install grafana-agent and add Calico scraping information to the configuration file:
helm install -n calico-monitoring pyroscope-agent grafana/grafana-agent -f https://raw.githubusercontent.com/frozenprocess/pyroscope_observability_blog/main/scrape-pprof.yamlScraping any application with eBPF-based probes
Some applications may not offer profiling capabilities. In that case, you can use the pyroscope.ebpf block to profile that application using eBPF programs in Linux.
Use the following command to edit the grafana agent:
helm upgrade -n calico-monitoring pyroscope-agent grafana/grafana-agent -f https://raw.githubusercontent.com/frozenprocess/pyroscope_observability_blog/main/scrape-combine.yamlNote: eBPF profiling requires grafana-agent container to start in the privileged access mode viarootuser.
Congratulations! You have successfully configured your Pyroscope to use eBPF probes and scrape the Calico Go pprof server to achieve continuous profiling. At this point, you should be able to see both Felix and Typha profiles in your Pyroscope applications dropdown. You can navigate to specific components and examine both profiling methods in detail.
The following image illustrates the Pyroscope dashboard:

Conclusion
In conclusion, by capturing profiling data at regular intervals from your Kubernetes cluster or applications, you can gain valuable insights into your system’s behavior, quickly detect anomalies, and pinpoint areas that may require optimization. This proactive monitoring ensures that your system remains efficient and reliable. In this blog post, we’ve explored how profiling can benefit your environment and how you can enable it using Calico’s native capabilities or for any other application by using eBPF-based probes. By incorporating profiling into your monitoring strategy, you’ll be able to optimize your system’s performance, improve its reliability, and gain valuable insights into its behavior.
Learn more about Calico and Kubernetes network monitoring


Join our mailing list
Get updates on blog posts, workshops, certification programs, new releases, and more!