What Are Prometheus Metrics?
Prometheus metrics are time-series data points gathered via an HTTP pull model. Applications expose data at a /metrics endpoint in a key-value format using labels, which the Prometheus server regularly scrapes and stores for real-time querying, dashboarding (for example, via Grafana), and alerting.
Prometheus is an open-source tool for collecting metrics and sending alerts. It was developed by SoundCloud. It has the following primary components:
- The core Prometheus app – This is responsible for scraping and storing metrics in an internal time series database, or sending data to a remote storage backend. The app allows you to retrieve the metrics when queried.
- Exporters – These are add-ons that ingest data from various sources and produce scrapable metrics for the Prometheus app. Exporters are external programs purpose-built for specific hardware or applications.
- AlertManager – A system that manages alerts with Prometheus.
- Client Libraries – These can be used to instrument your applications for monitoring by Prometheus.
Prometheus monitoring works by identifying a target, which is an endpoint that supplies metrics for Prometheus to store. Targets may be physical endpoints or an exporter that attaches to a system and generates metrics from it. Endpoints are either supplied by a static configuration or discovered through a service discovery process.
When Prometheus has gathered a list of targets, it can start retrieving metrics. Metrics are retrieved via simple HTTP requests. The configuration directs Prometheus to a specific location on the target that provides a stream of text, which describes the metric and its current value.
Prometheus offers four core metric types:
- Counter: A cumulative metric that only goes up, or resets to 0 on restart. Used to track counts of events like requests, errors, or completed tasks (for example, http_requests_total).
- Gauge: A numerical value that can go up and down. Used for measurable states like memory usage, queue size, or current active requests.
- Histogram: Samples observations such as request durations or response sizes and counts them in configurable buckets, while providing the sum of all observed values.
- Summary: Similar to a histogram, but it calculates configurable quantiles (such as P90, P95, P99) directly on the client side over a sliding time window.
There are two main ways to collect metrics:
- Direct instrumentation: Use an official Prometheus client library (Go, Python, Java, Node.js) to build metric endpoints directly into your application code.
- Exporters: Deploy pre-built community exporters to collect system-level metrics, such as Node Exporter for hardware or the Redis Exporter for databases.
Related: many teams also feed these endpoints into their container security workflows to correlate runtime signals with policy enforcement.
In this article, you will learn:
- What Metrics Does Prometheus Provide?
- Common Prometheus Use Cases and Associated Metrics
- Prometheus Functions and Operators
- Using Prometheus Exporters
- Kubernetes Observability and Monitoring with Calico
Prometheus Metric Format Example
When a service exposes its metrics, they appear as human-readable, plain text. Each line shows the metric name, any labels, and its current value:
# HELP http_requests_total The total number of HTTP requests.
# TYPE http_requests_total counter
http_requests_total{method="GET", status="200"} 10593
http_requests_total{method="POST", status="200"} 421
What Metrics Does Prometheus Provide?
Prometheus monitors endpoints and offers four different types of metrics:
Counter
This cumulative metric is suitable for tracking the number of requests, errors or completed tasks (for example, http_requests_total). It cannot decrease, and must either go up or be reset to zero.
Counters should be used for:
- Recording a value that only increases
- Assessing the rate of increase (later queries can show how fast the value rises)
Use cases for counters include request count, tasks completed, and error count.
Gauge
This point-in-time metric can go both up and down. It is suitable for measuring current memory use and concurrent requests.
Gauges should be used for:
- Recording a value that may go up or down
- Cases where you don’t need to query the rate of the value
Use cases for gauges include queue size, memory usage, and the number of requests in progress.
Histogram
This metric is suitable for aggregated measures, including request durations, response sizes, and Apdex scores that measure application performance. Histograms sample observations and categorize data into buckets that you can customize.
Histograms should be used for:
- Multiple measurements of a single value, allowing for the calculation of averages or percentiles
- Values that can be approximate
- A range of values that you determine in advance, by using default definitions in a histogram bucket, or your custom values
Use cases for histograms include request duration and response size.
Summary
This metric is suitable for accurate quantiles, calculated directly on the client side over a sliding time window. A summary samples observations and provides a total count of observations, as well as a sum of observed values, and calculates quantiles such as P90, P95, and P99.
Summaries should be used for:
Multiple measurements of a single value, allowing for the calculation of averages or percentiles
Values that can be approximate
A range of values that you cannot determine upfront, so histograms are not appropriate
Use cases for summaries include request duration and response size.
Common Prometheus Use Cases and Associated Metrics
Here are a few common use cases of Prometheus, and the metrics most appropriate to use in each case.
CPU Usage
The metric used here is “node_cpu_seconds_total”. This is a counter metric that counts the number of seconds the CPU has been running in a particular mode. The CPU has several modes such as iowait, idle, user, and system. Because the objective is to count usage, use a query that excludes idle time:
sum by (cpu)(node_cpu_seconds_total{mode!="idle"})
The sum function is used to combine all CPU modes. The result shows how many seconds the CPU has run from the start. To tell if the CPU has been busy or idle recently, use the rate function to calculate the growth rate of the counter:
(sum by (cpu)(rate(node_cpu_seconds_total{mode!="idle"}[5m]))*100
The above query produces the rate of increase over the last five minutes, which lets you see how much computing power the CPU is using. To get the result as a percentage, multiply the query by 100.
Memory Usage
The following query calculates the total percentage of used memory:
node_memory_Active_bytes/node_memory_MemTotal_bytes*100
To obtain the percentage of memory use, divide used memory by the sum and multiply by 100.
Free Disk
You need to know your free disk usage to understand when there needs to be more space on the infrastructure nodes. Again, the same memory usage method is used here, but with different metric names.
node_filesystem_avail_bytes/node_filesystem_size_bytes*100
Prometheus Functions and Operators
Prometheus has its own native query language, PromQL, which you use to select, aggregate, and compute over metrics. For example, rate(http_requests_total[5m]) calculates the per-second rate of HTTP requests over the last five minutes.
Prometheus offers several operators and functions that can help you perform calculations on metrics, to make them more useful. You saw the use of some of these functions in the examples above.
Aggregation Operators
These reduce an instant vector to a different instant vector that represents the same number of label sets or less. This is done by aggregating the values of multiple label sets or by prioritizing the distinct sets and discarding the rest. A simple aggregation operator may appear as avg(metric_per_second), providing the average speed of all instances in the set.
Another option that allows you to differentiate instances by labels is avg(metrics_per_second) by (project, location). This averages speed only for those instances that belong to the same project and are located in the same region (based on labels attached to the metrics). You can select the labels you want to keep for the new vector, or alternatively, discard a label you don’t want.
There are several aggregations available, most notably sum, min, max, and avg. The more complex aggregators may take additional parameters—for example, the following aggregator provides the three highest speeds overall:
topk(3, metric_per_second)
Binary Operators
An arithmetic binary operator (+, -, *, /, %, ^), where “%” stands for a modulo operation and “^” stands for arithmetic power operation, can work with a combination of scalars and instant vectors, which can quickly become mathematically complex.
The following is a summary of some cases and how you might handle the unusual cases that arise when dealing with vector arithmetic:
- Scalar-to-scalar arithmetic – This is essential primary school arithmetic.
- Scalar-to-vector arithmetic – Apply the calculation with the scalar for every value in the vector.
- Vector-to-vector arithmetic – This is where things become interesting. It involves matching labels, and you calculate the vectors with perfectly matching labels toward each other, while discarding all other values.
Functions
The functions in Prometheus are similar to typical programming functions, except they are restricted to a predefined set. Most Prometheus functions are approximate—the results are extrapolated, so what should be an integer calculation may occasionally be turned into floating point values. This means that you should use Prometheus functions with care in cases that require high precision.
Here are three examples of especially useful functions. For each of these functions, a range vector is taken as an input and an instant vector is produced.
deltaoperates on gauge metrics and outputs the difference between the beginning and end of a range.increaseandrateuse counter metrics and output the increase over a specified time.increaseprovides the total increase, whilerateprovides the per-second increase.histogram_quantilefunction, which can be used to make sense of histogram buckets. This function takes two arguments: the quantile to be calculated and the instant vector of the bucket. You can use the commandhistogram_quantile(0.95, sum(metric_speed_bucket) by (le)), which outputs the speed of instances in the 95-percentile of the histogram bucket. The statementby (le)sums the metric time before performing the quantile calculation.
Using Prometheus Exporters
There are various Prometheus exporters you can use to monitor your applications and cloud services. It might be challenging to figure out which exporter you should use.
Have a look at the Exporters and Integrations page on the Prometheus website. Evaluate the suitability of each exporter for the kind of metrics you need. You could also assess the health of an exporter as a software project—how many contributors, stars, and whether it is frequently updated. Here are a few guidelines that can help you evaluate the suitability of an exporter for your needs.
If you are deploying exporters and Prometheus servers on Kubernetes, the Prometheus Operator can simplify managing their lifecycle through custom resources.
Understand Exporter Metrics
Every exporter comes with a set of metrics that it generates. It is a best practice, but not mandatory, for Prometheus exporters to provide this information. You can usually find metrics details on the exporter’s repository main page, but you may need to search in a documentation page or help file. Some exporters use the OpenMetrics format, which can provide fields with additional information regarding the metric, such as the type, info, or units.
Check the exporter documentation to understand how you can label the metrics and make sense of them. Instrumentation labels are useful for analyzing what is happening inside an application, while target labels are useful when aggregating metrics across an entire deployment.
For example, an instrumentation label may provide context such as whether it is from a dev environment or production service, or on which host the service is running. On the other hand, you can use target labels to answer questions such as: “What is the current CPU usage of all backend applications in North America?”
Set Meaningful and Actionable Alerts
When you are learning to use a new cloud or application monitoring tool, such as a Prometheus exporter, it can be challenging to handle alerts. If your alerts are set with a low threshold, this could quickly oversaturate your support teams with alerts. On the other hand, if your alerts don’t trigger in time, you could miss important information regarding a condition that may be affecting your end users.
When developing an alert strategy, you first need to understand your applications and the Prometheus exporters you are using. Your organization’s Service Level Indicators and Service Level Objectives, coupled with golden signals for your service or application, can help you determine which elements are critical and require an alert.
Kubernetes Observability and Monitoring with Calico
Calico Cloud and Calico Enterprise provide Kubernetes-native observability and monitoring, helping rapidly pinpoint and resolve performance, connectivity, and security policy issues between microservices running on Kubernetes clusters across the entire stack.
For teams already running Prometheus on Kubernetes, these capabilities complement existing scrape targets with cluster-aware service, DNS, and packet-level visibility.
They offer the following key features for Kubernetes-native observability and monitoring, which are not available with Prometheus:
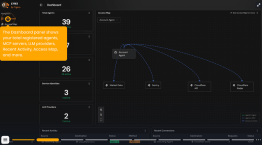
- Dynamic Service Graph – A point-to-point, topographical representation of traffic flow and policy that shows how workloads within the cluster are communicating, and across which namespaces. Also includes advanced capabilities to filter resources, save views, and troubleshoot service issues.
- DNS Dashboard – Helps accelerate DNS-related troubleshooting and problem resolution in Kubernetes environments by providing an interactive UI with exclusive DNS metrics.
- Dynamic Packet Capture – Captures packets from a specific pod or collection of pods with specified packet sizes and duration, in order to troubleshoot performance hotspots and connectivity issues faster.
- Application-level Observability – Provides a centralized, all-encompassing view of service-to-service traffic in the Kubernetes cluster to detect anomalous behavior like attempts to access applications or restricted URLs, and scans for particular URLs.
Learn more about Calico for Kubernetes monitoring and observability