Kubernetes is an API-driven platform. Every action happens through an API call into the kube API server. Consequently, recording and monitoring API activity is very important. While most deployments end up sending these logs to a remote destination for compliance purposes, these logs are often not easily accessible when needed. Moreover, different roles (platform, network, security) have different requirements, and many may not even have access to the logs.
Some use cases relevant to log analysis are as follows.
- A policy change resulted in a sudden outage of a service. How do you find out which policies have changed in the last 24 hours? [development, network, security]
- You are maintaining a critical namespace and want to monitor every pod that comes up in that namespace. Can you get an alert if a pod is created in that namespace? [platform, security]
- You are responsible for maintaining the cluster. Sometimes there’s a significant variation in the resource consumption. You want to receive an email with the past 24 of resource utilization (pods, namespaces, network connections etc.) every morning. [platform]
Calico Enterprise retains the audit logs for 1 year by default, and helps you in answering the questions above.
How does it work?
Calico Enterprise uses an Elasticsearch operator to deploy an Elasticsearch cluster and a Kibana instance. The Elasticsearch cluster is used to store audit logs according to specified retention settings to ensure the cluster does not run out of disk space. Elasticsearch and Kibana are integrated and managed as part of the Calico Enterprise lifecycle. By default, the audit logs and reports are stored for 1 year.
Calico policy logs are stored in elasticsearch database. These are generated offline and so do not impact the Calico data path performance. Also the low volume means upto 1 year of logs is stored by default.
Log collection is a straightforward configuration, with retention and filtering options. Hence we recommend that it should be part of your install activities. After you have configured the audit logs, you can visualize those in the kibana dashboard. Calico Enterprise offers 3 features on top of audit logs.
- Policy changelog helps you in identifying all changes for the life of a policy.
- Inventory reports help you generate custom reports for yourself, compliance teams, or even dev teams.
- Global alerts helps in creating custom alerting for events of interest.
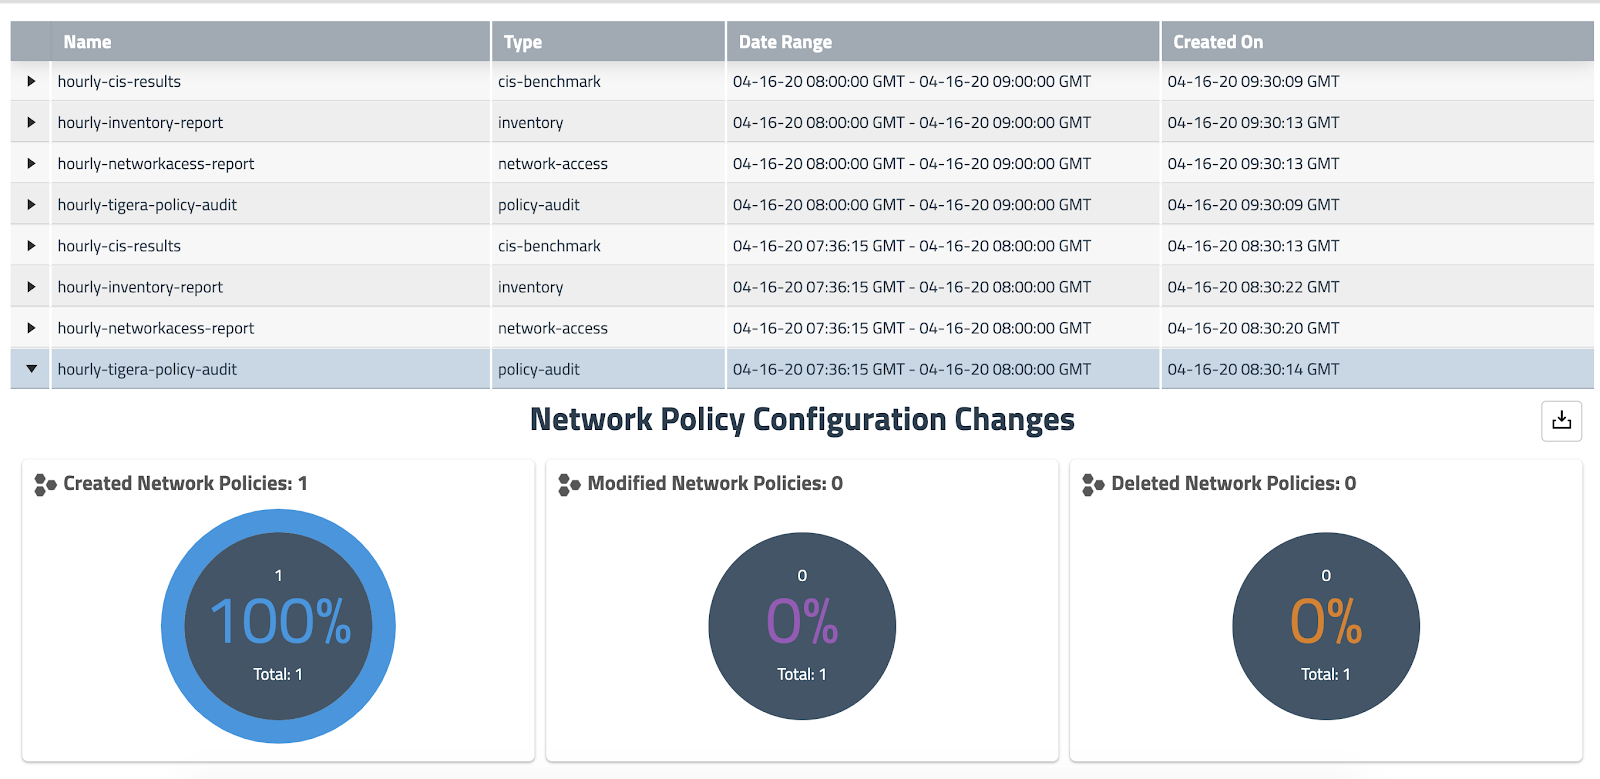
The following diagram shows the snapshot of reports being generated on an hourly basis. These reports are instances of a kubernetes object (GlobalReports CRD), and so can be access controlled using kubernetes RBAC in a multi-tenant deployment.
Why does this matter?
- Audit logs give you visibility into every change that happens to your kubernetes resources (pod, network policy, namespace, etc.). Often it is a mandatory compliance requirement to keep evidence of change.
- Policy changelog enables you to quickly troubleshoot operational issues resulting because of policy changes in the past.
- You can create custom alerts on any types of audit log based on multiple constraints. This helps platform and security teams to detect events of interest (eg. someone modifying a policy, someone accessing the cloud metadata etc.).
How do I enable Audit Logs and Reports?
Audit logs for Calico policy are enabled by default. As an important first step, you must enable Kubernetes audit logs for pods and namespaces. Use YAML interface to configure compliance reports and global alerts. For results, use the following:
- Compliance interface on Calico Enterprise manager to review the generated reports.
- Kibana Audit logs to search, filter, create dashboards etc.
- Per-policy user interface to review policy changelog.
- Alerts interface on Calico Enterprise manager to review the generated alerts.
Click on the links below to learn more about Calico Enterprise Audit Logs
Audit Logs:
https://docs.tigera.io/security/logs/elastic/ee-audit
Compliance Reports:
https://docs.tigera.io/security/compliance-reports/overview
https://docs.tigera.io/security/compliance-managed-cloud
GlobalAlerts:
https://docs.tigera.io/security/threat-detection-and-prevention/alerts
Join our mailing list
Get updates on blog posts, workshops, certification programs, new releases, and more!