The Domain Name System (DNS) is a naming system for computers, services, or other resources connected to the Internet or a private network. DNS translates domain names to the numerical IP addresses needed for locating and identifying computer services and devices. For decades It’s been an essential component of the Internet. It’s an essential part of Kubernetes as well, and is used to determine how workloads connect to Kubernetes services as well as resources outside the cluster.
DNS also happens to be a common source of outages and issues in Kubernetes clusters. When applications are not working as expected, the root cause is often DNS-related. However, debugging and troubleshooting DNS issues in Kubernetes environments is not a trivial task given the limited amount of information Kubernetes provides for DNS queries.
Lacking the necessary visibility into the cluster to correlate a DNS query or reply with a specific workload, for example, you are left in the dark. Without Kubernetes context, you are unable to capture even the most fundamental information needed for troubleshooting, such as the type of DNS query (or reply) or the source of the query.
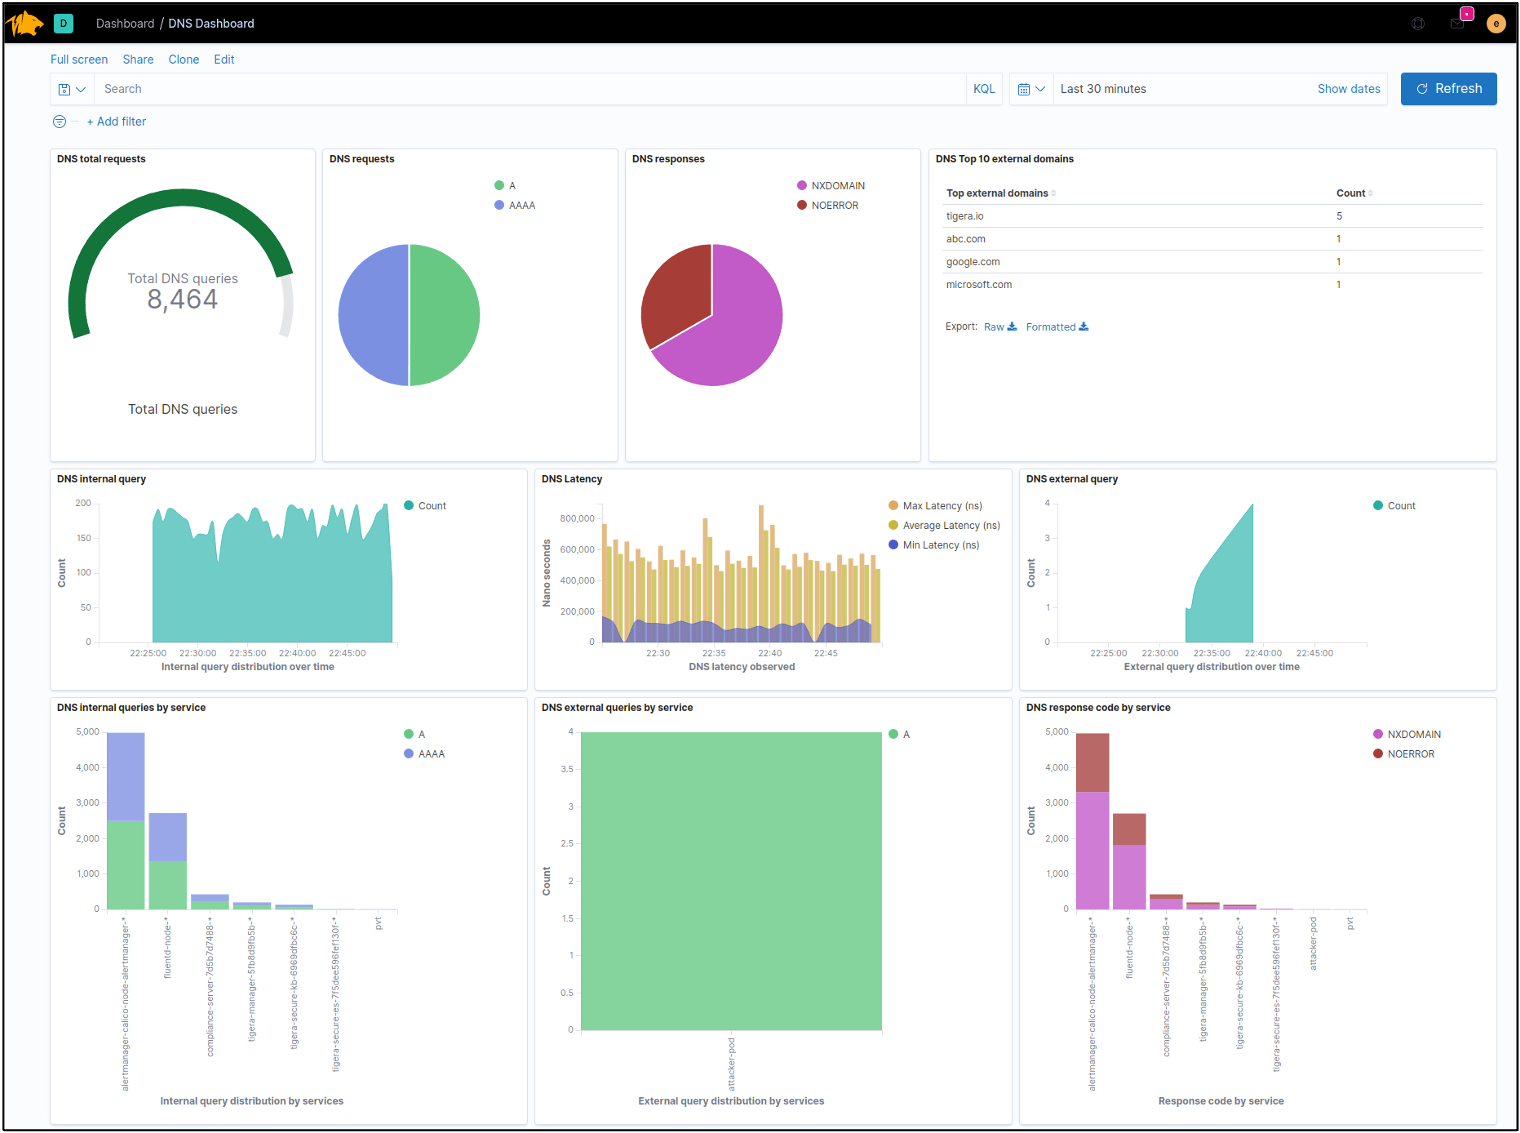
Figure: The DNS Dashboard from Tigera helps Kubernetes teams more quickly confirm or eliminate DNS as the root cause for microservice and application connectivity issues, and eliminates a lot of manual, time-consuming introspection that would typically be required. No other vendor offers this automated capability.
Introducing DNS Dashboard for Kubernetes
So how can you gain enough visibility into what is going on in DNS to quickly pin-point and efficiently troubleshoot issues? To solve this problem, our engineering team at Tigera has created the DNS Dashboard based on the DNS log data available in Calico Enterprise. It’s included in Calico Enterprise, is purpose-built for Kubernetes and provides an interactive GUI that enables you to:
- View the total number of DNS queries and replies
- Classify queries and replies by record type, for example CNAME, A, AAAA, MX, SRV, etc.
- Determine the source of a query and whether it is from a workload or service
- Filter on troubleshooting scenarios
- Automatically log all DNS queries and replies
The DNS Dashboard helps Kubernetes teams more quickly confirm or eliminate DNS as the root cause for microservice and application connectivity issues, and eliminates a lot of manual, time-consuming introspection that would typically be required. No other vendor offers this automated capability.
Classify and View DNS Codes by Service
With the DNS Dashboard, you can view DNS codes by service. For example, if there is a Kubernetes service failure you can determine which service was queried, and can then further explore that service. Classifying queries and replies by service greatly simplifies the troubleshooting process and speeds problem resolution, immediately answering many of the questions that arise when troubleshooting connectivity issues:
- Which DNS servers are in use?
- Who is making the queries?
- What types of queries are being made?
- What replies are they receiving? Are there errors?
- How many queries of a particular service are being made?
- What is the minimum, maximum and average latency?
- How much data was transmitted/received by a service or pod?
All DNS Activity is Automatically Logged
As a CNI, Calico Enterprise is in the unique position of being able to monitor traffic flows to look for DNS queries and replies, and is able to generate a special set of DNS log data for all Kubernetes activity. This capability is not offered in Kubernetes by default.
External queries to domains outside the purview of Kubernetes are also logged by the DNS Dashboard. So if your pod is talking to the Internet or some other resource outside the cluster, you’ll know what domains it’s using and how many queries it’s making. Within the cluster there is a lot of noise, with services talking to other services. The DNS Dashboard cuts through the clutter and displays the Top 10 domains that are external to your cluster.
Security and Compliance Considerations
Application developers and DevOps aren’t the only teams that can benefit from the rich set of data that’s provided by DNS Dashboard and Calico Enterprise. Since all query data is logged, Security teams can apply Global Alerts in Calico Enterprise to define alerts that are automatically triggered based on certain criteria using the logged data. Security teams can answer the following questions:
- What DNS servers are being queried?
- How much data is being transferred and received by each pod?
- How many queries are being received?
Abnormal DNS behavior like an unusually high number of queries may indicate unauthorized data exfiltration via DNS and a flaw in your network policy such as a misconfiguration. NXDOMAINS in external requests, especially over TXT or CNAME requests, may suggest a DGA, infiltration or exfiltration attempt by an attacker. External queries to unknown domains may also represent suspicious behavior.
In any of these use cases, the automation that drives the Calico Enterprise DNS Dashboard can quickly confirm or eliminate DNS as the root cause of the issue, thus speeding troubleshooting and problem resolution in Kubernetes environments.
————————————————————————————-
Free Online Training
Access Live and On-Demand Kubernetes Training
Calico Enterprise – Try Now
Kubernetes Networking, Security and Observability in Hybrid and Multi-Clouds
Join our mailing list
Get updates on blog posts, workshops, certification programs, new releases, and more!