In this article, we will dive into Kubernetes network monitoring and metrics, examining these concepts in detail and exploring how metrics in an application can be transformed into tangible, human-readable reports. The article will also include a step-by-step tutorial on how to enable Calico’s integration with Prometheus, a free and open-source CNCF project created for monitoring the cloud. By the end of the article, you will be able to create customized reports and graphical dashboards from the metrics that Calico publishes to get better insight into the inner workings of your cluster and its various components. In addition, you will have the fundamental knowledge of how these pieces can fit together to establish Kubernetes network monitoring for any environment.
Background
The benefits offered by cloud computing and infrastructure as code, including scalability, easy distribution, and quick and flexible deployment, have caused cloud service adoption to skyrocket. But this rapid adoption requires checks and balances to ensure that cloud services are secure and running in their desired state. Furthermore, any security events and problems should be logged and reported for future examination.
Read our guide on Kubernetes logging: Approaches and best practices
In the past, traditional monitoring solutions such as Nagios and Zabbix dominated the monitoring landscape. On a fundamental level, a traditional monitoring model uses a pull-based system to query the environment components and draw a conclusion. An ICMP-based check is arguably the most iconic monitoring query to be named that uses the pull-based system. While it is possible to use a traditional system to monitor a cloud-native environment, its monolithic and rigid architecture will limit your ability to take advantage of every aspect of a cloud environment. To overcome this issue, you should consider using a push-based monitoring system that can reduce the operational complexity, network and security overhead, and attack surface for the resources you need to monitor.
Now, let’s go through a brief overview of Kubernetes and Project Calico.
Calico and Kubernetes networking
Kubernetes has an abstract approach to networking, and it relies on software capable of using Container Networking Interface (CNI) to establish networking for its resources and components.
Project Calico is a community behind a pure network-layer (Layer 3) approach to virtual networking and security for highly scalable data centers. It offers Calico Open Source, a free and open-source networking and network security solution for containers, virtual machines, and native host-based workloads. Calico offers many features such as IP address management, network overlay, pluggable dataplane (Linux, eBPF, and VPP), and many more. On top of these features, Calico can expose metrics to give you insight into the health of your environment. If you need help running a Kubernetes cluster, check out this CNCF on-demand webinar on Calico installation best practices.
Kubernetes network monitoring and metrics
Every application is constantly trying to gain access to system hardware resources by communicating with the CPU in order to perform its tasks, even when we are interacting with the application through its graphical user interface (GUI). While we may only see the higher-level application interfaces, the application is constantly running in the background to meet our needs.
In a development environment, application developers can use breakpoints to stall the process and peek into an application’s inner workings to determine the application’s health. In a production environment, however, such an interruption can carry a high cost since it momentarily renders the service unresponsive. As a workaround, developers usually implement logic in their code to expose these valuable pieces of information to the end users. These predefined values are usually referred to as monitoring metrics.
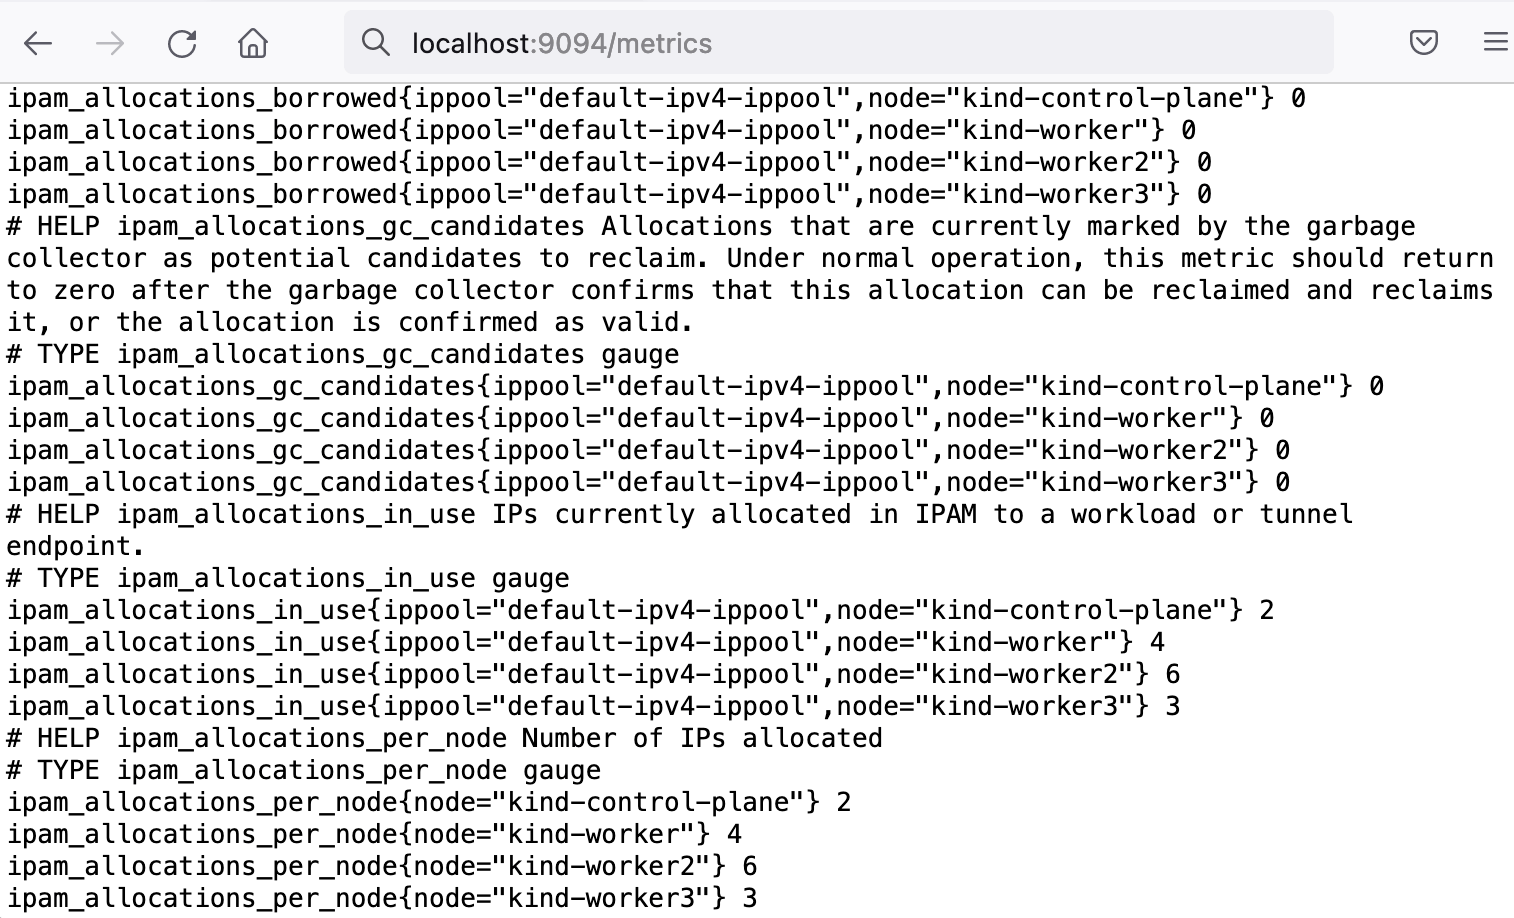
For example, Calico is capable of publishing its health and performance metrics via HTTP protocol. These metrics can be accessed by other programs and used to automate tasks and identify potential issues with the system. One type of metric that Calico tracks is related to its IP address management (IPAM) component, which includes information on how many workloads have acquired IP addresses and the availability of IP addresses in a particular IP pool. In addition to IPAM metrics, Calico also tracks multiple other metrics that can be used to assess the health and performance of the Calico system and its networking elements.
The following snapshot shows the results of the calico-kube-controllers-metrics service:
It is important to note that application metrics are not stored and are only exposed to the observer on-demand in real time. To store and process these metrics, we need to rely on other applications such as Prometheus. A full list of available Calico metrics can be found here.
Kubernetes network monitoring with Prometheus
Prometheus is a free and open-source CNCF project that can collect and scrape metrics from various sources. Prometheus can act as a central repository for gathering and storing system metrics and can be used to generate comprehensive reports that translate technical information into a non-technical business language. Non-technical reports can make it easier for others to understand the health and performance of your systems and help them to make informed decisions based on that information. These reports can be used to monitor the performance and reliability of systems, identify issues, and track trends over time. Read our learn guide, Prometheus for Kubernetes, to learn more about Prometheus, how it works, and its pros and cons.
Prometheus configuration
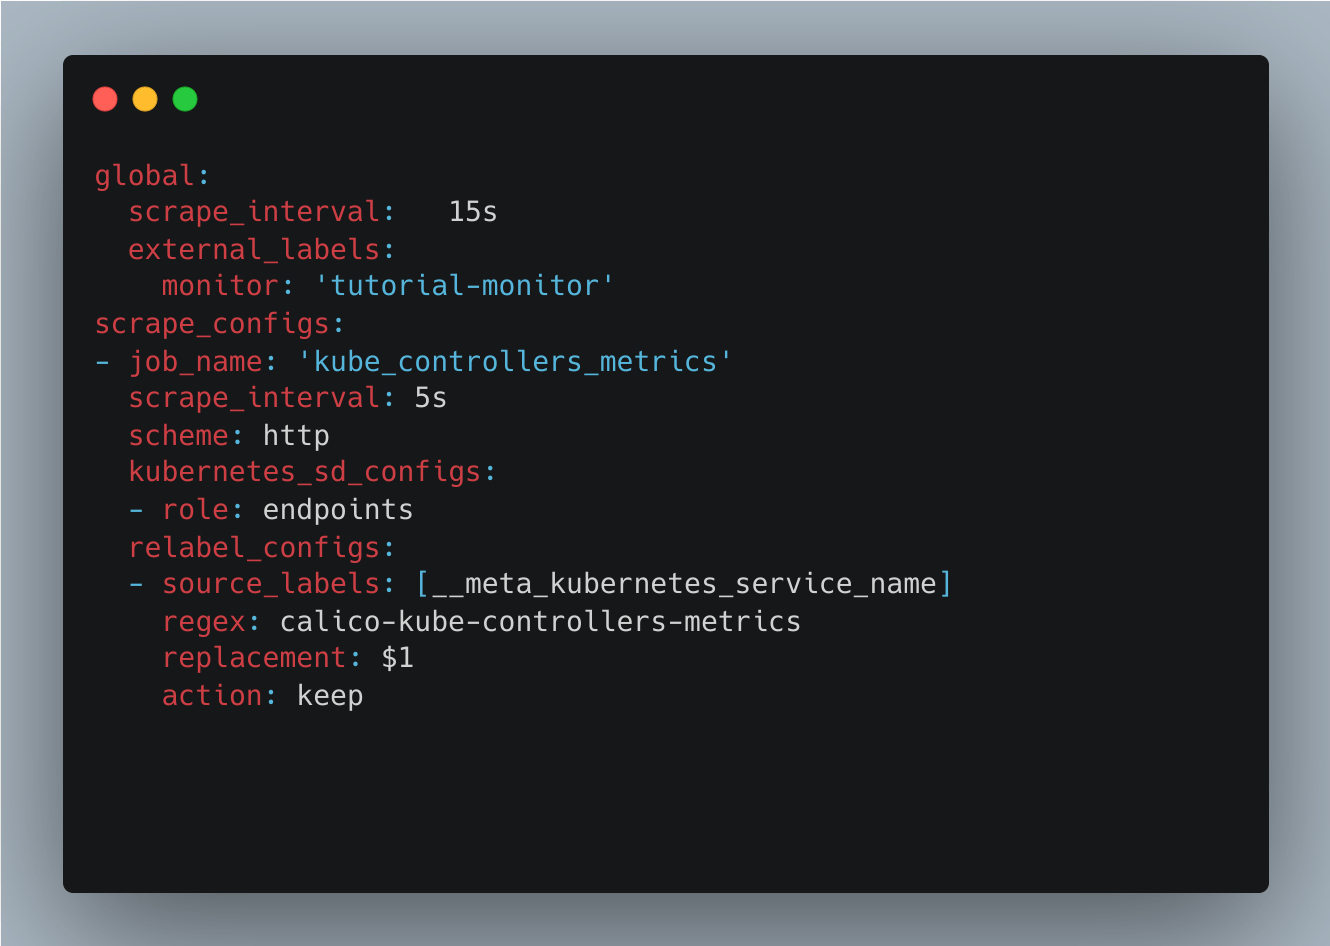
Prometheus maintains on-disk checkpoints of series data and supports remote read/write to other storage systems, making it an easy solution to integrate with most systems. But it is your responsibility to let Prometheus know where to scrape your data from, which is usually done by command-line flags and a configuration file.
The following picture illustrates a configuration that scrapes Calico metric values from a Kubernetes service named calico-kube-controllers-metrics:
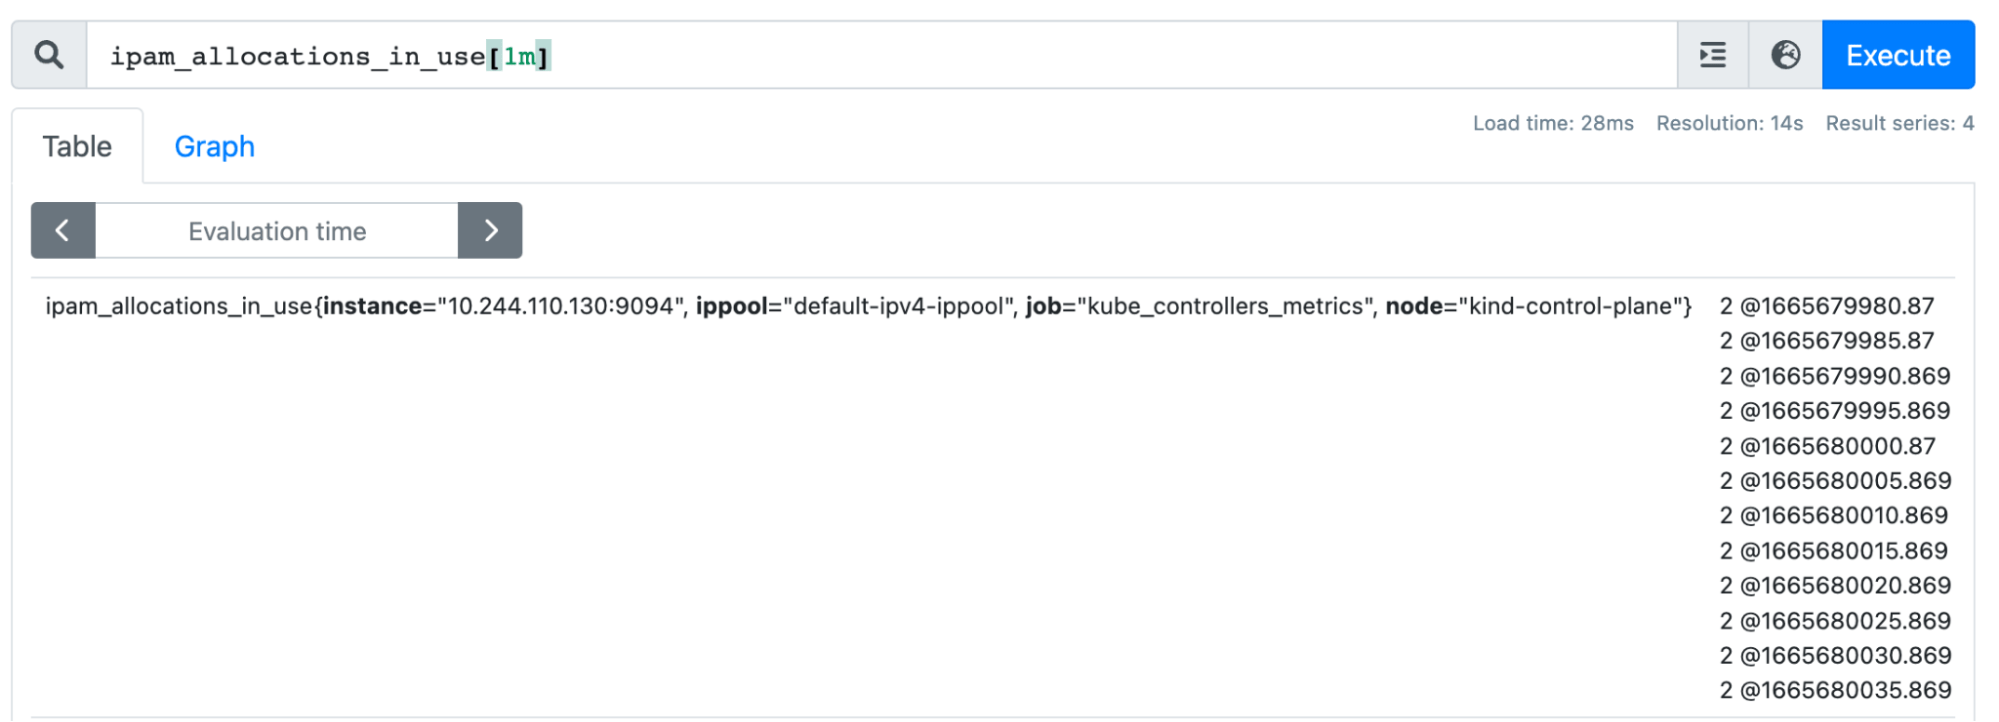
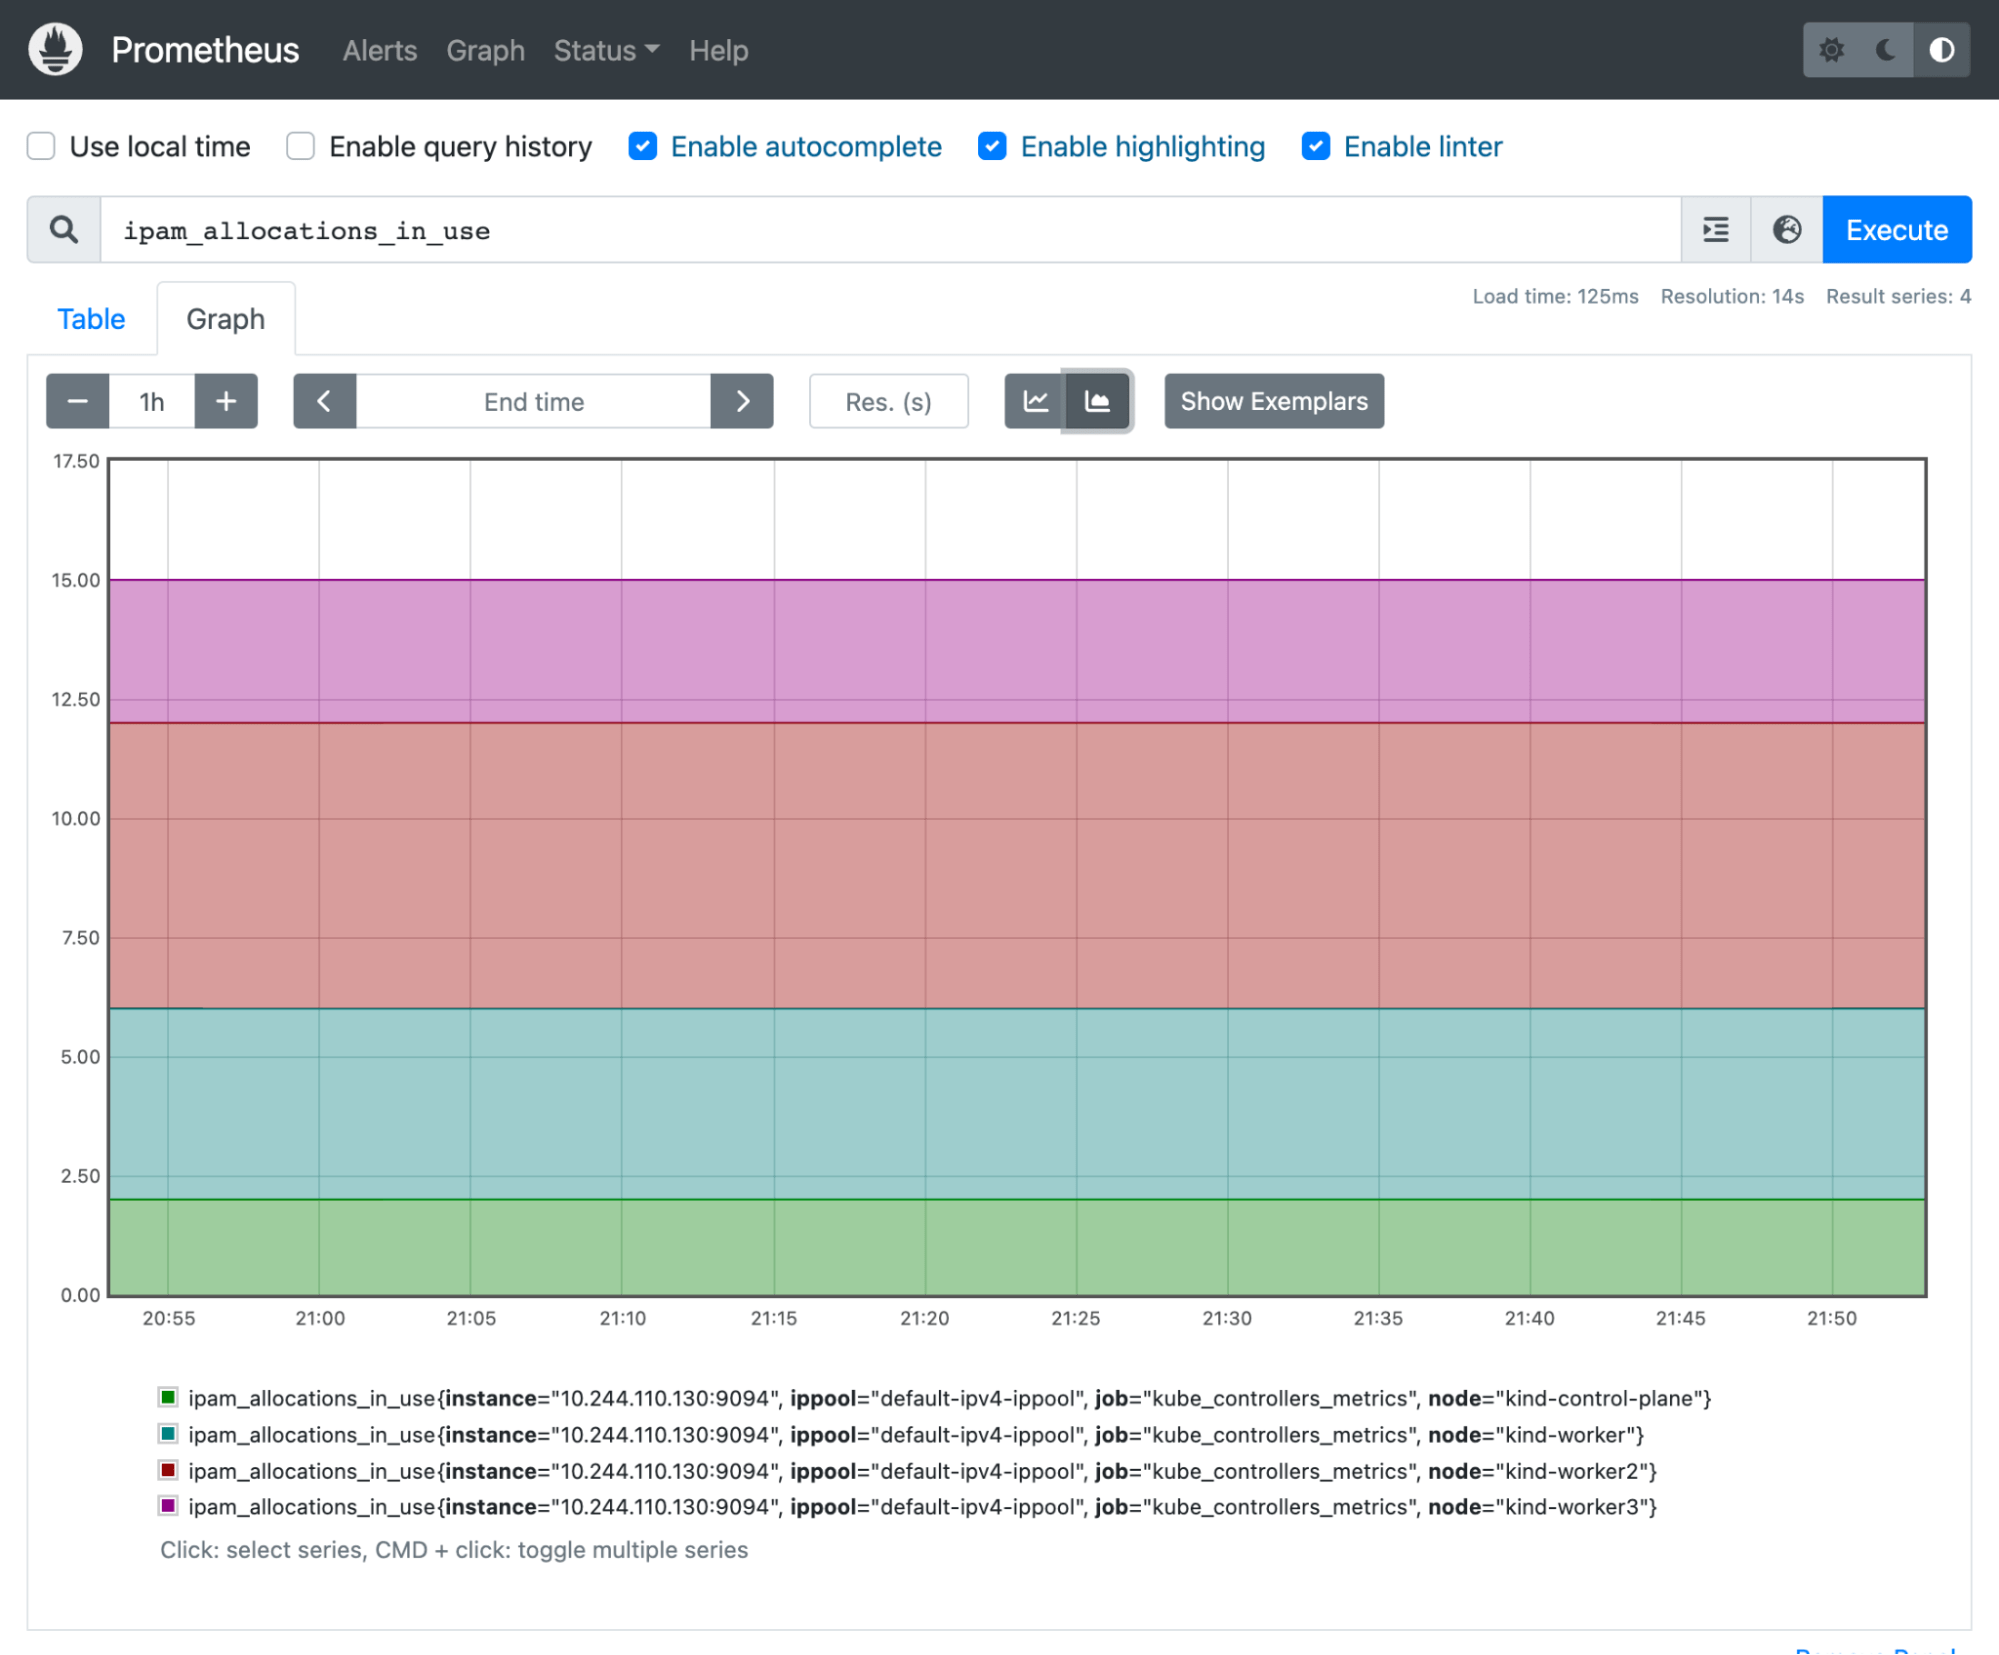
Predefined metrics are usually built around measuring service availability and performance aspects of software during runtime. Storing these pieces of information can give you better insight into how your environment is doing during a specific period of time. A centric collection of such values can allow you to process these different metrics to build reports with other values.
The following image illustrates the value of ipam_allocations_in_use metrics over a period of 1-minute increments:
Note: You can enable Calico metrics and Prometheus integration by following the monitor Calico component metrics documentation.
Processing metrics
Prometheus is not just a simple metric storage system; it also offers a powerful way to interact with time-series-based values that are stored in its database. Prometheus Query Language (PromQL) is a custom query language designed to query time-series and multi-dimensional data to manipulate the stored metrics and create or mutate the result into better indicators. PromQL also implements math/datetime and other operator functions that can help us create proactive reports to build our cloud-native monitoring platform.
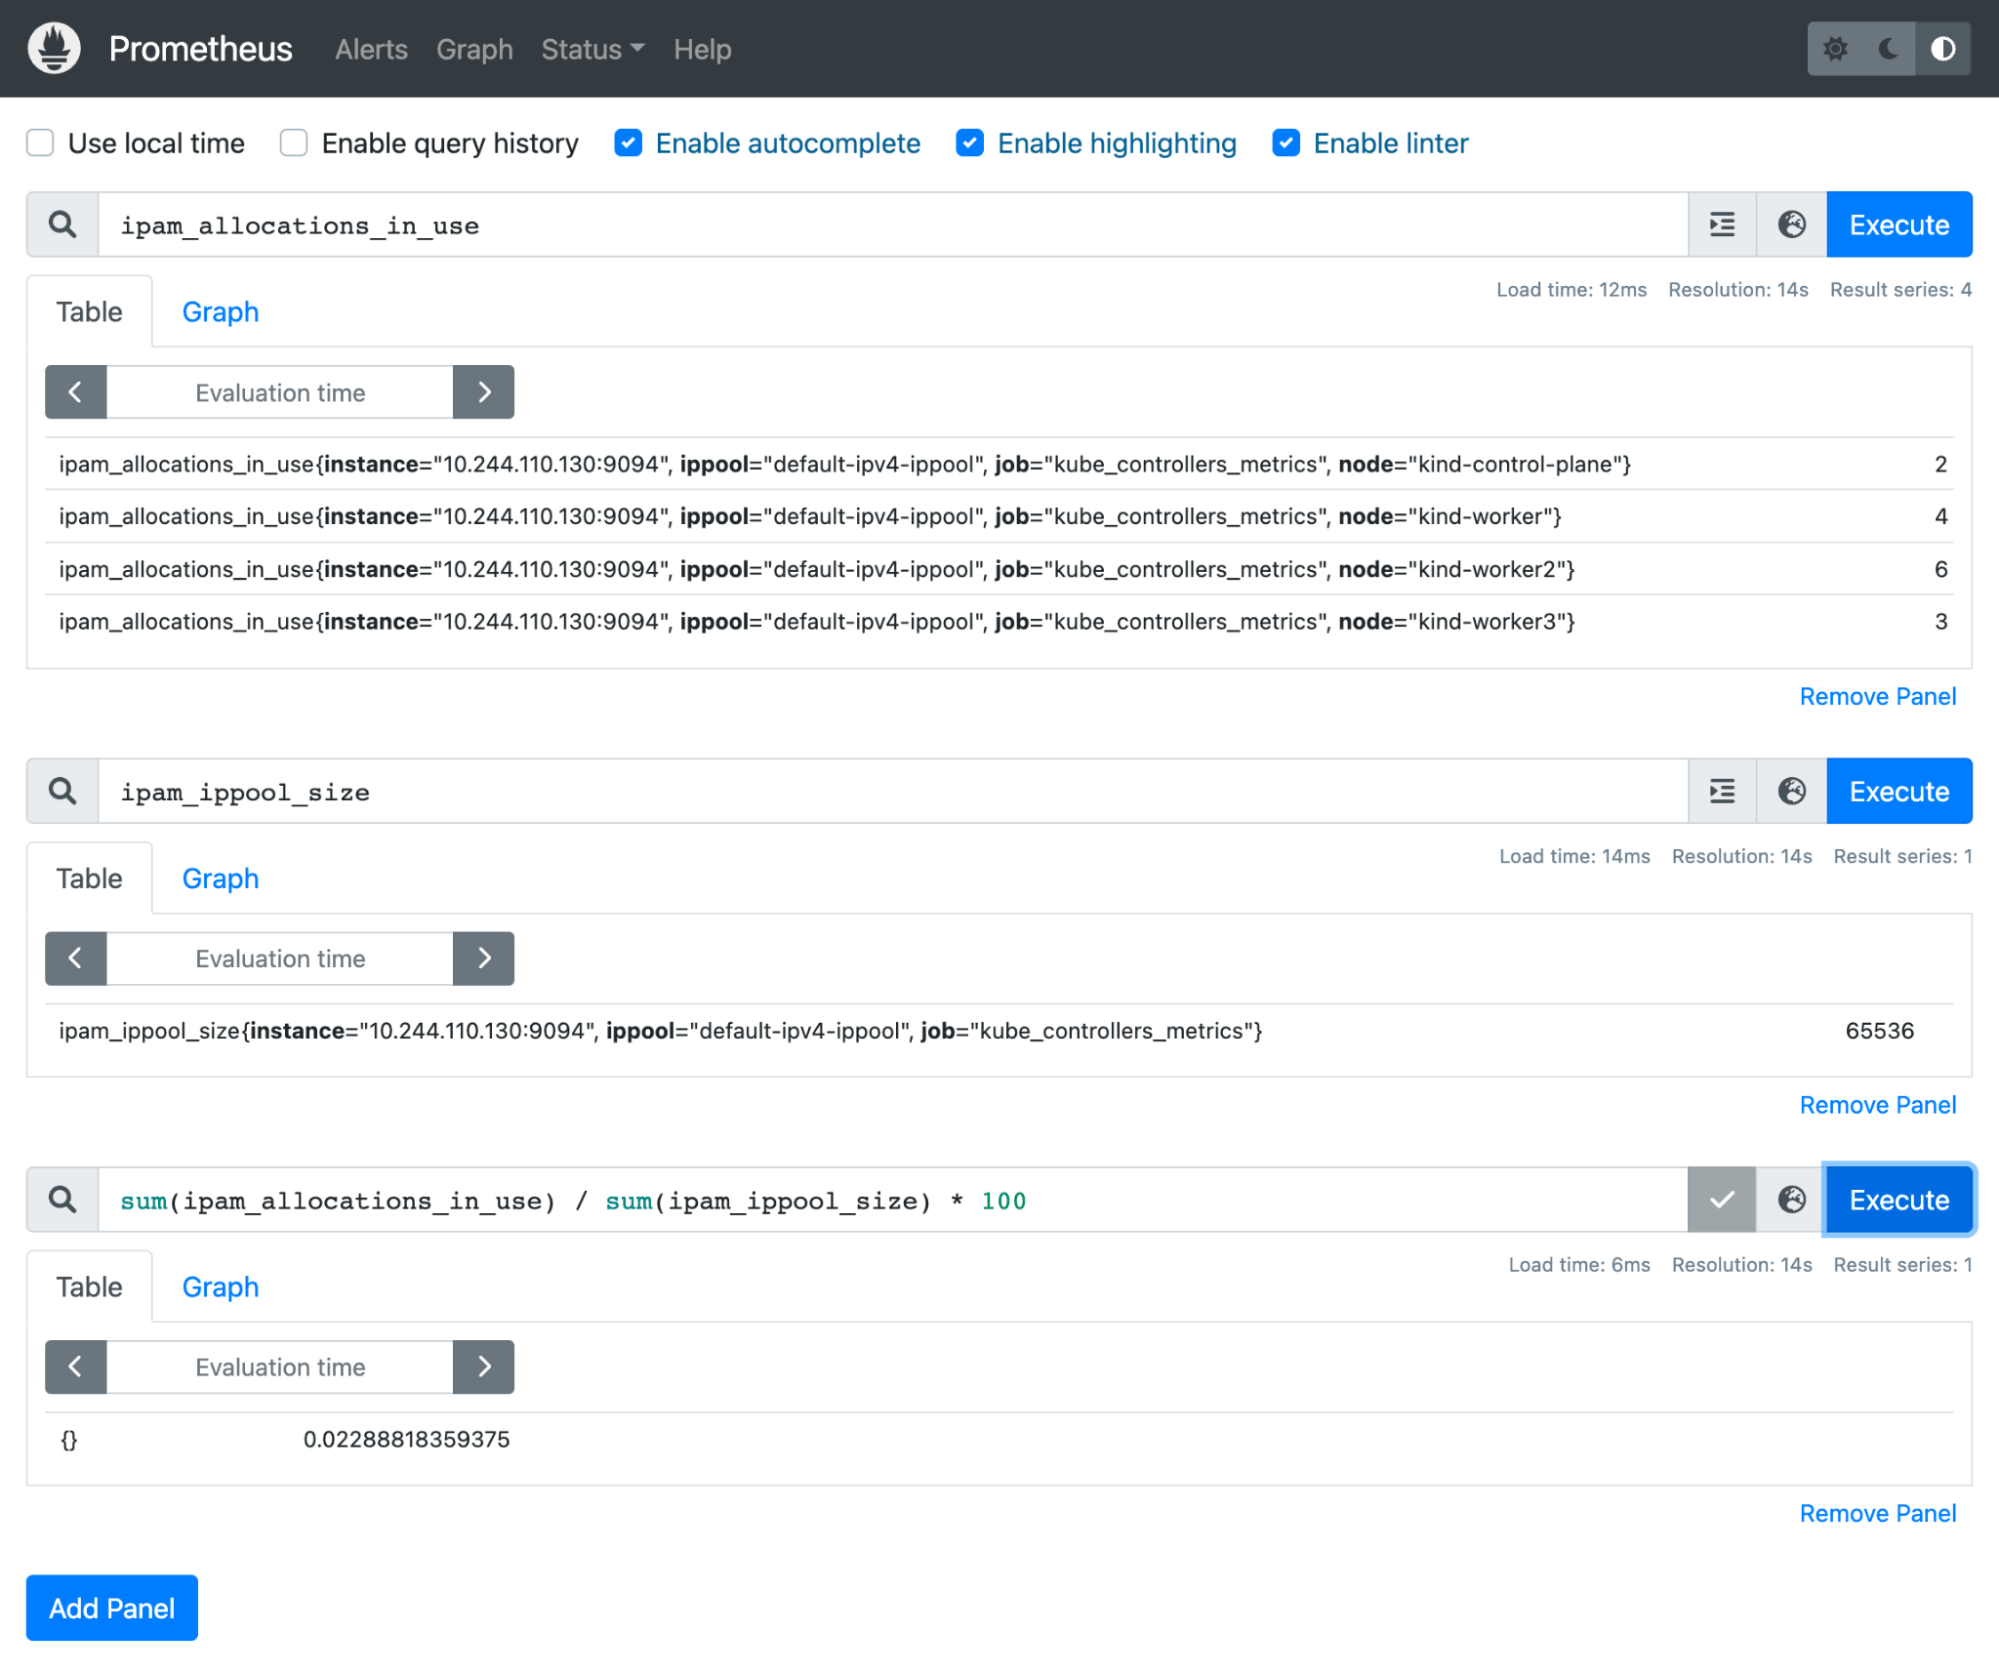
For example, our previous metric, ipam_allocations_in_use, shows how many IPs are currently used from our ippools in each participating cluster node. We also know that ipam_ippool_size gives us the total number of available IP addresses in our ippools.
Using PromQL, we could write a simple line to show the current percentage of our available IP addresses among our ippools;
sum(ipam_allocations_in_use)/sum(ipam_ippool_size)*100
The following image illustrates how PromQL can be used to aggregate individual metrics:
It is also worth noting that Prometheus can represent metric values in the form of a graph:
Prometheus graphs are a simple way to add visualizations to your data for Kubernetes network monitoring. However, since Prometheus is not focused on visualization, your graph options are limited. More intuitive visual representations will require you to install other visualization software, such as Grafana, which we’ll discuss in the next section.
Note: If you’d like to learn more about PromQL, visit this website.
Visualization
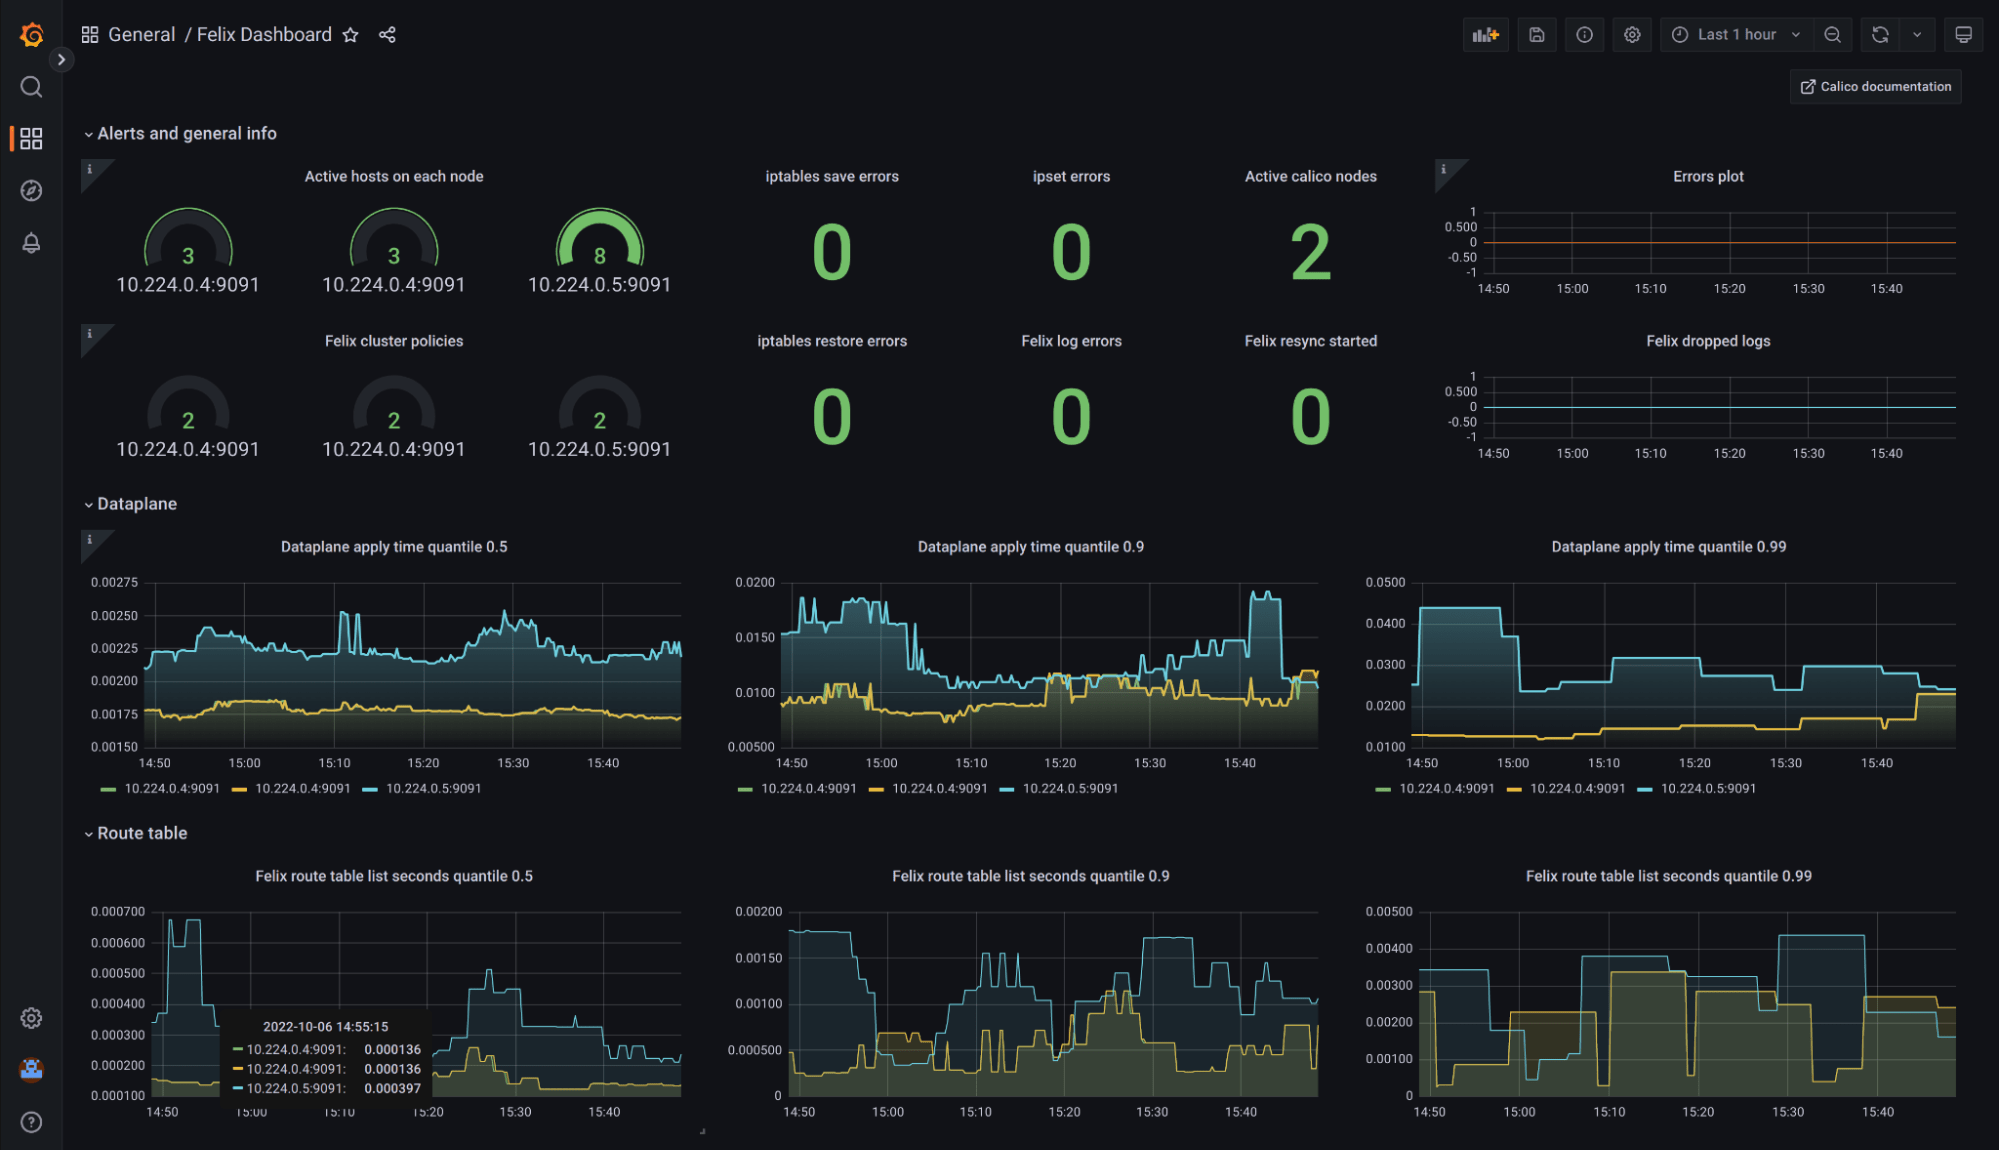
Grafana, another great CNCF open-source project, could be a better option for visualizing metrics. Grafana can consume Prometheus as a data source and use its storage to create permanent visualizations. Since Grafana has a built-in authentication and authorization mechanism, you can build permissions to permit or deny access to your dashboards.
The following image illustrates Calico metrics in a Grafana dashboard:
Note: The visualizing metrics via Grafana documentation is a great step-by-step guide to guide you in configuring Prometheus and Grafana in your Calico-equipped cluster.
Conclusion
In this article, we have gone through the fundamentals of Kubernetes network monitoring and explored how open-source projects such as Calico, Prometheus, and Grafana can be used together to run a cloud-native monitoring platform.
Ready for more? Check out this learn guide, Prometheus Monitoring: Use Cases, Metrics, and Best Practices.
Join our mailing list
Get updates on blog posts, workshops, certification programs, new releases, and more!
