






What Is Kubernetes Observability Software?
Kubernetes observability software refers to tools and solutions that help organizations monitor, analyze, and troubleshoot Kubernetes-based environments. Kubernetes is a container orchestration platform that manages containerized applications at scale, but its complexity can make it difficult to identify performance bottlenecks or issues.
Beyond performance, teams running containerized workloads also need to consider container security, since observability data is most useful when paired with strong security controls across the cluster.
For a broader view of protecting clusters, workloads, and the control plane, see our guide to Kubernetes security.
Observability software provides insight into system performance, resource utilization, and application health by collecting and analyzing data such as metrics, logs, and traces. This data lets teams identify and resolve performance or availability problems.
Unlike traditional monitoring, which focuses on predefined metrics, observability covers the broader scope of understanding a system’s internal behavior by querying its output data. Modern Kubernetes observability tools integrate with multiple data sources and allow for visualization of real-time and historical information.
Editor’s note: Updated the article to cover recent Kubernetes observability market trends, updated information for Kubernetes observability software to reflect features and capabilities in 2026.
This is part of a series of articles about Kubernetes monitoring.
In this article:
- Kubernetes Observability Market and Trends
- Key Features of Kubernetes Observability Software
- Notable Kubernetes Observability Software
Kubernetes Observability Market and Trends
Market Size and Growth Forecast
According to recent market research, the global Kubernetes observability market is valued at over USD 1.4 billion. Growth is driven by rapid container adoption and the rising complexity of cloud-native systems. As more organizations move to Kubernetes to manage containerized workloads, the need for deeper visibility into these environments continues to increase.
The market is projected to grow at a compound annual growth rate (CAGR) of 18.6% to reach USD 6.82 billion by 2033. This expansion reflects the critical role observability plays in maintaining performance, reliability, and security in distributed systems.
A key driver is the shift from monolithic applications to microservices architectures. Microservices increase the number of services, dependencies, and runtime interactions. This makes traditional monitoring tools insufficient. Organizations are investing in observability platforms that can correlate metrics, logs, and traces across dynamic Kubernetes environments.
Deployment Models: On-Premises and Cloud
Kubernetes observability solutions are deployed either on-premises or in the cloud:
- On-premises deployments are common in large enterprises and regulated industries. These organizations require strict control over infrastructure and data. On-premises models allow deeper customization and integration with legacy systems, which is important in complex IT environments.
- Cloud-based solutions are growing faster due to scalability and ease of deployment. As companies adopt multi-cloud and hybrid architectures, they need tools that can monitor distributed Kubernetes clusters across providers. SaaS-based observability platforms reduce operational overhead, provide automatic updates, and integrate with cloud services.
- Hybrid models are also emerging. They allow organizations to combine cloud scalability with on-premises control for sensitive workloads.
Adoption by Organization Size
Large enterprises represent the largest share of the market. They operate complex Kubernetes clusters across multiple environments and require advanced analytics, scalability, and compliance features. Observability is often part of broader risk management and operational resilience strategies.
Small and medium enterprises (SMEs) are a fast-growing segment. As cloud-native technologies become more accessible, SMEs adopt Kubernetes to accelerate development and reduce costs. However, they often lack specialized expertise. As a result, they prefer cloud-based, automated observability platforms with prebuilt dashboards and managed services.
Vendors address both segments by offering modular and scalable solutions. Large enterprises demand customization and deep integration, while SMEs prioritize simplicity and fast deployment.
Key Features of Kubernetes Observability Software
Metrics Collection and Analysis
Metrics provide quantitative data about system performance, such as CPU utilization, memory usage, and network I/O. Kubernetes observability solutions collect these metrics through integrated systems like the Kubernetes metrics server or third-party tools such as Prometheus. Analyzing these metrics helps teams monitor resource usage trends, predict potential bottlenecks, and optimize application deployments.
Tools offer capabilities like multi-cluster monitoring and query-based analytics, enabling teams to analyze performance across distributed environments. With these insights, teams can detect anomalies in real-time and implement optimizations before issues escalate.
Logging
Logs offer detailed, event-level insights into Kubernetes environments. Observability tools centralize log data from nodes, pods, and containers to provide a unified view of system events. These logs are essential for understanding root causes during issue diagnosis, as they capture what occurred at various points in time.
Logs typically include debugging information, error messages, and operational events critical for troubleshooting production-level issues. Many Kubernetes observability systems leverage log aggregation and indexing tools like Fluentd, Logstash, or Elasticsearch. These tools allow users to search, filter, and analyze enormous volumes of log data.
Distributed Tracing
Distributed tracing provides end-to-end visibility into application request flows, making it particularly useful in microservices architectures like Kubernetes. Traces show how requests move through different services, capturing detailed performance data for each step along the way. This allows observability tools to pinpoint where latency, bottlenecks, or failures occur.
Modern observability tools often use open standards like OpenTelemetry to instrument distributed tracing. By correlating traces with metrics and logs, these tools create a more holistic view of application health. Distributed tracing is crucial for optimizing response times by identifying the root cause of degraded performance across dependent systems.
Event Monitoring
Event monitoring involves capturing changes and actions within Kubernetes clusters, such as pod restarts, configuration updates, or scaling events. These events can have significant impacts on application performance and stability. Observability software aggregates and organizes event data, helping teams monitor cluster activity and identify underlying issues.
Effective event monitoring tools integrate with Kubernetes’ API system to provide high-fidelity data without excessive overhead. They often provide automatic correlation between events and performance metrics, enabling swift root cause analysis.
Visualization and Dashboards
Visualization transforms complex data into easy-to-understand graphical representations. Dashboards consolidate performance metrics, logs, and traces into an intuitive interface, allowing teams to monitor system health efficiently. Real-time visualizations highlight critical information, such as resource usage spikes, pod errors, or cluster anomalies.
Custom dashboards let teams tailor the interface to meet their needs, focusing on metrics relevant to their applications or environments. Advanced tools allow users to build interactive dashboards to drill down into datasets. This visualization aids in identifying trends and simplifying collaboration between operations and development teams.
Alerting and Notification
Alerting and notification systems warn teams of potential issues in Kubernetes environments. Configurable alerts can monitor specified thresholds, such as CPU usage exceeding a set percentage or latency crossing acceptable limits. Alerts are typically delivered through integrations with communication tools like Slack, Microsoft Teams, or email systems.
Effective observability software supports smart alerting features, such as noise reduction and anomaly detection, to avoid alert fatigue. Automated alerting helps ensure that critical problems are addressed promptly, reducing application downtime. These tools are indispensable for maintaining the operational stability of Kubernetes-based systems.
Related content: Read our guide to Kubernetes monitoring tools
Notable Kubernetes Observability Software
1. Calico by Tigera

Calico is a unified network security and observability platform to prevent, detect and mitigate security breaches in Kubernetes clusters. It helps rapidly pinpoint and resolve performance, connectivity, and security policy issues between microservices running on Kubernetes clusters across the entire stack. Calico does this by providing context about microservices, pods, and namespaces so that multiple teams can collaborate effectively to identify and resolve issues.
License: Apache License 2.0
Repository: https://github.com/projectcalico/calico
GitHub stars: 67.1K
Contributors: 400+
Key features include:
- Dynamic Service Graph: A point-to-point, topographical representation of traffic flow and policy that shows how workloads within the cluster are communicating, and across which namespaces. Also includes advanced capabilities to filter resources, save views, and troubleshoot service issues.
- DNS Dashboard: Helps accelerate DNS-related troubleshooting and problem resolution in Kubernetes environments by providing an interactive UI with exclusive DNS metrics.
- L7 Dashboard: Provides a high-level view of HTTP communication across the cluster, with summaries of top URLs, request duration, response codes, and volumetric data for each service.
- Dynamic Packet Capture: Captures packets from a specific pod or collection of pods with specified packet sizes and duration, in order to troubleshoot performance hotspots and connectivity issues faster.
- Application-level Observability: Provides a centralized, all-encompassing view of service-to-service traffic in the Kubernetes cluster to detect anomalous behavior like attempts to access applications or restricted URLs, and scans for particular URLs.
- Unified Controls: A single, unified management plane provides a centralized point-of-control for unified security and observability on multiple clouds, clusters, and distros. Users can monitor and observe across environments with a single pane of glass.
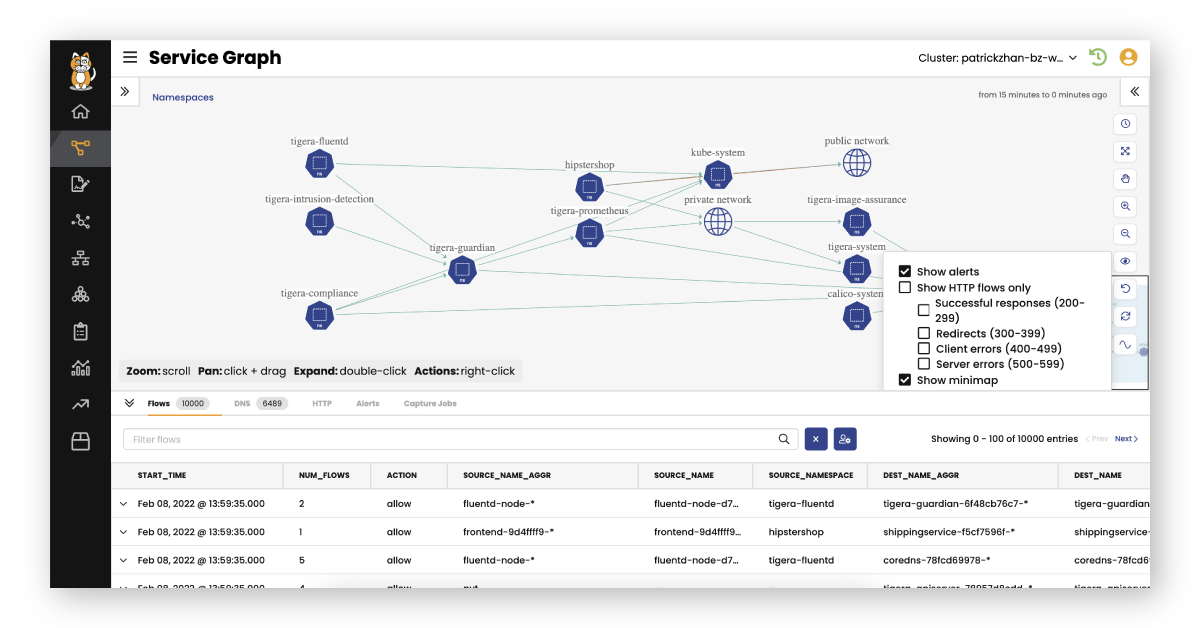
Source: Tigera
2. Prometheus
Prometheus is an open-source monitoring and alerting toolkit commonly used in Kubernetes environments to collect and analyze metrics from distributed systems. It stores metrics as time-series data with timestamps and labels, allowing teams to analyze performance trends and system behavior over time. Prometheus gathers metrics from instrumented services using HTTP endpoints and stores them locally for querying, analysis, and alert generation.
License: Apache License 2.0
Repository: https://github.com/prometheus/prometheus
GitHub stars: 63.2K
Contributors: 1K+
Key features include:
- Multi-dimensional metrics model: Stores time-series metrics identified by metric names and key-value label pairs.
- PromQL query language: Provides a flexible query language for analyzing and aggregating collected metrics.
- Pull-based data collection: Retrieves metrics from instrumented services over HTTP using a pull model.
- Service discovery: Automatically discovers monitoring targets through service discovery or static configuration.
- Standalone architecture: Runs as independent servers that do not rely on distributed storage.
- Integrated alerting support: Works with Alertmanager to generate and manage alerts based on monitoring rules.
3. Grafana

Grafana is an observability platform used to visualize metrics, logs, and other telemetry data from monitoring systems. In Kubernetes environments, Grafana often works with tools such as Prometheus or Loki to display system metrics and logs through interactive dashboards. These visualizations help teams understand system performance, investigate incidents, and analyze infrastructure behavior across clusters.
License: AGPL 3.0
Repository: https://github.com/grafana/grafana
GitHub stars: 72.7K
Contributors: 2.5K+
Key features include:
- Dashboard-based visualization: Provides graphical dashboards to visualize operational and infrastructure data.
- Log aggregation integration: Works with logging systems such as Loki to collect and display log data.
- Label-based data organization: Uses labels similar to Prometheus to group and query related log streams.
- Kubernetes log support: Automatically captures and indexes metadata such as Kubernetes pod labels for log streams.
- Centralized observability interface: Displays logs and other telemetry data in a single interface for analysis and troubleshooting.

Source: Grafana
4. Jaeger

Jaeger is an open-source distributed tracing platform used to observe and troubleshoot complex microservices-based applications. It tracks how requests move across services in a distributed system and visualizes the flow of data between components. This visibility helps engineers identify latency issues, service dependencies, and errors that occur during request processing.
License: Apache License 2.0
Repository: https://github.com/jaegertracing/jaeger
GitHub stars: 22.6K
Contributors: 400+
Key features include:
- Distributed tracing: Tracks requests as they travel across multiple services in a distributed architecture.
- Performance bottleneck detection: Helps identify slow or failing services that affect overall application performance.
- Root cause analysis: Enables investigation of failures by connecting traces across system components.
- Service dependency analysis: Maps relationships between services to understand how systems interact.
- Scalable cloud-native design: Built to support large distributed systems and microservices environments.
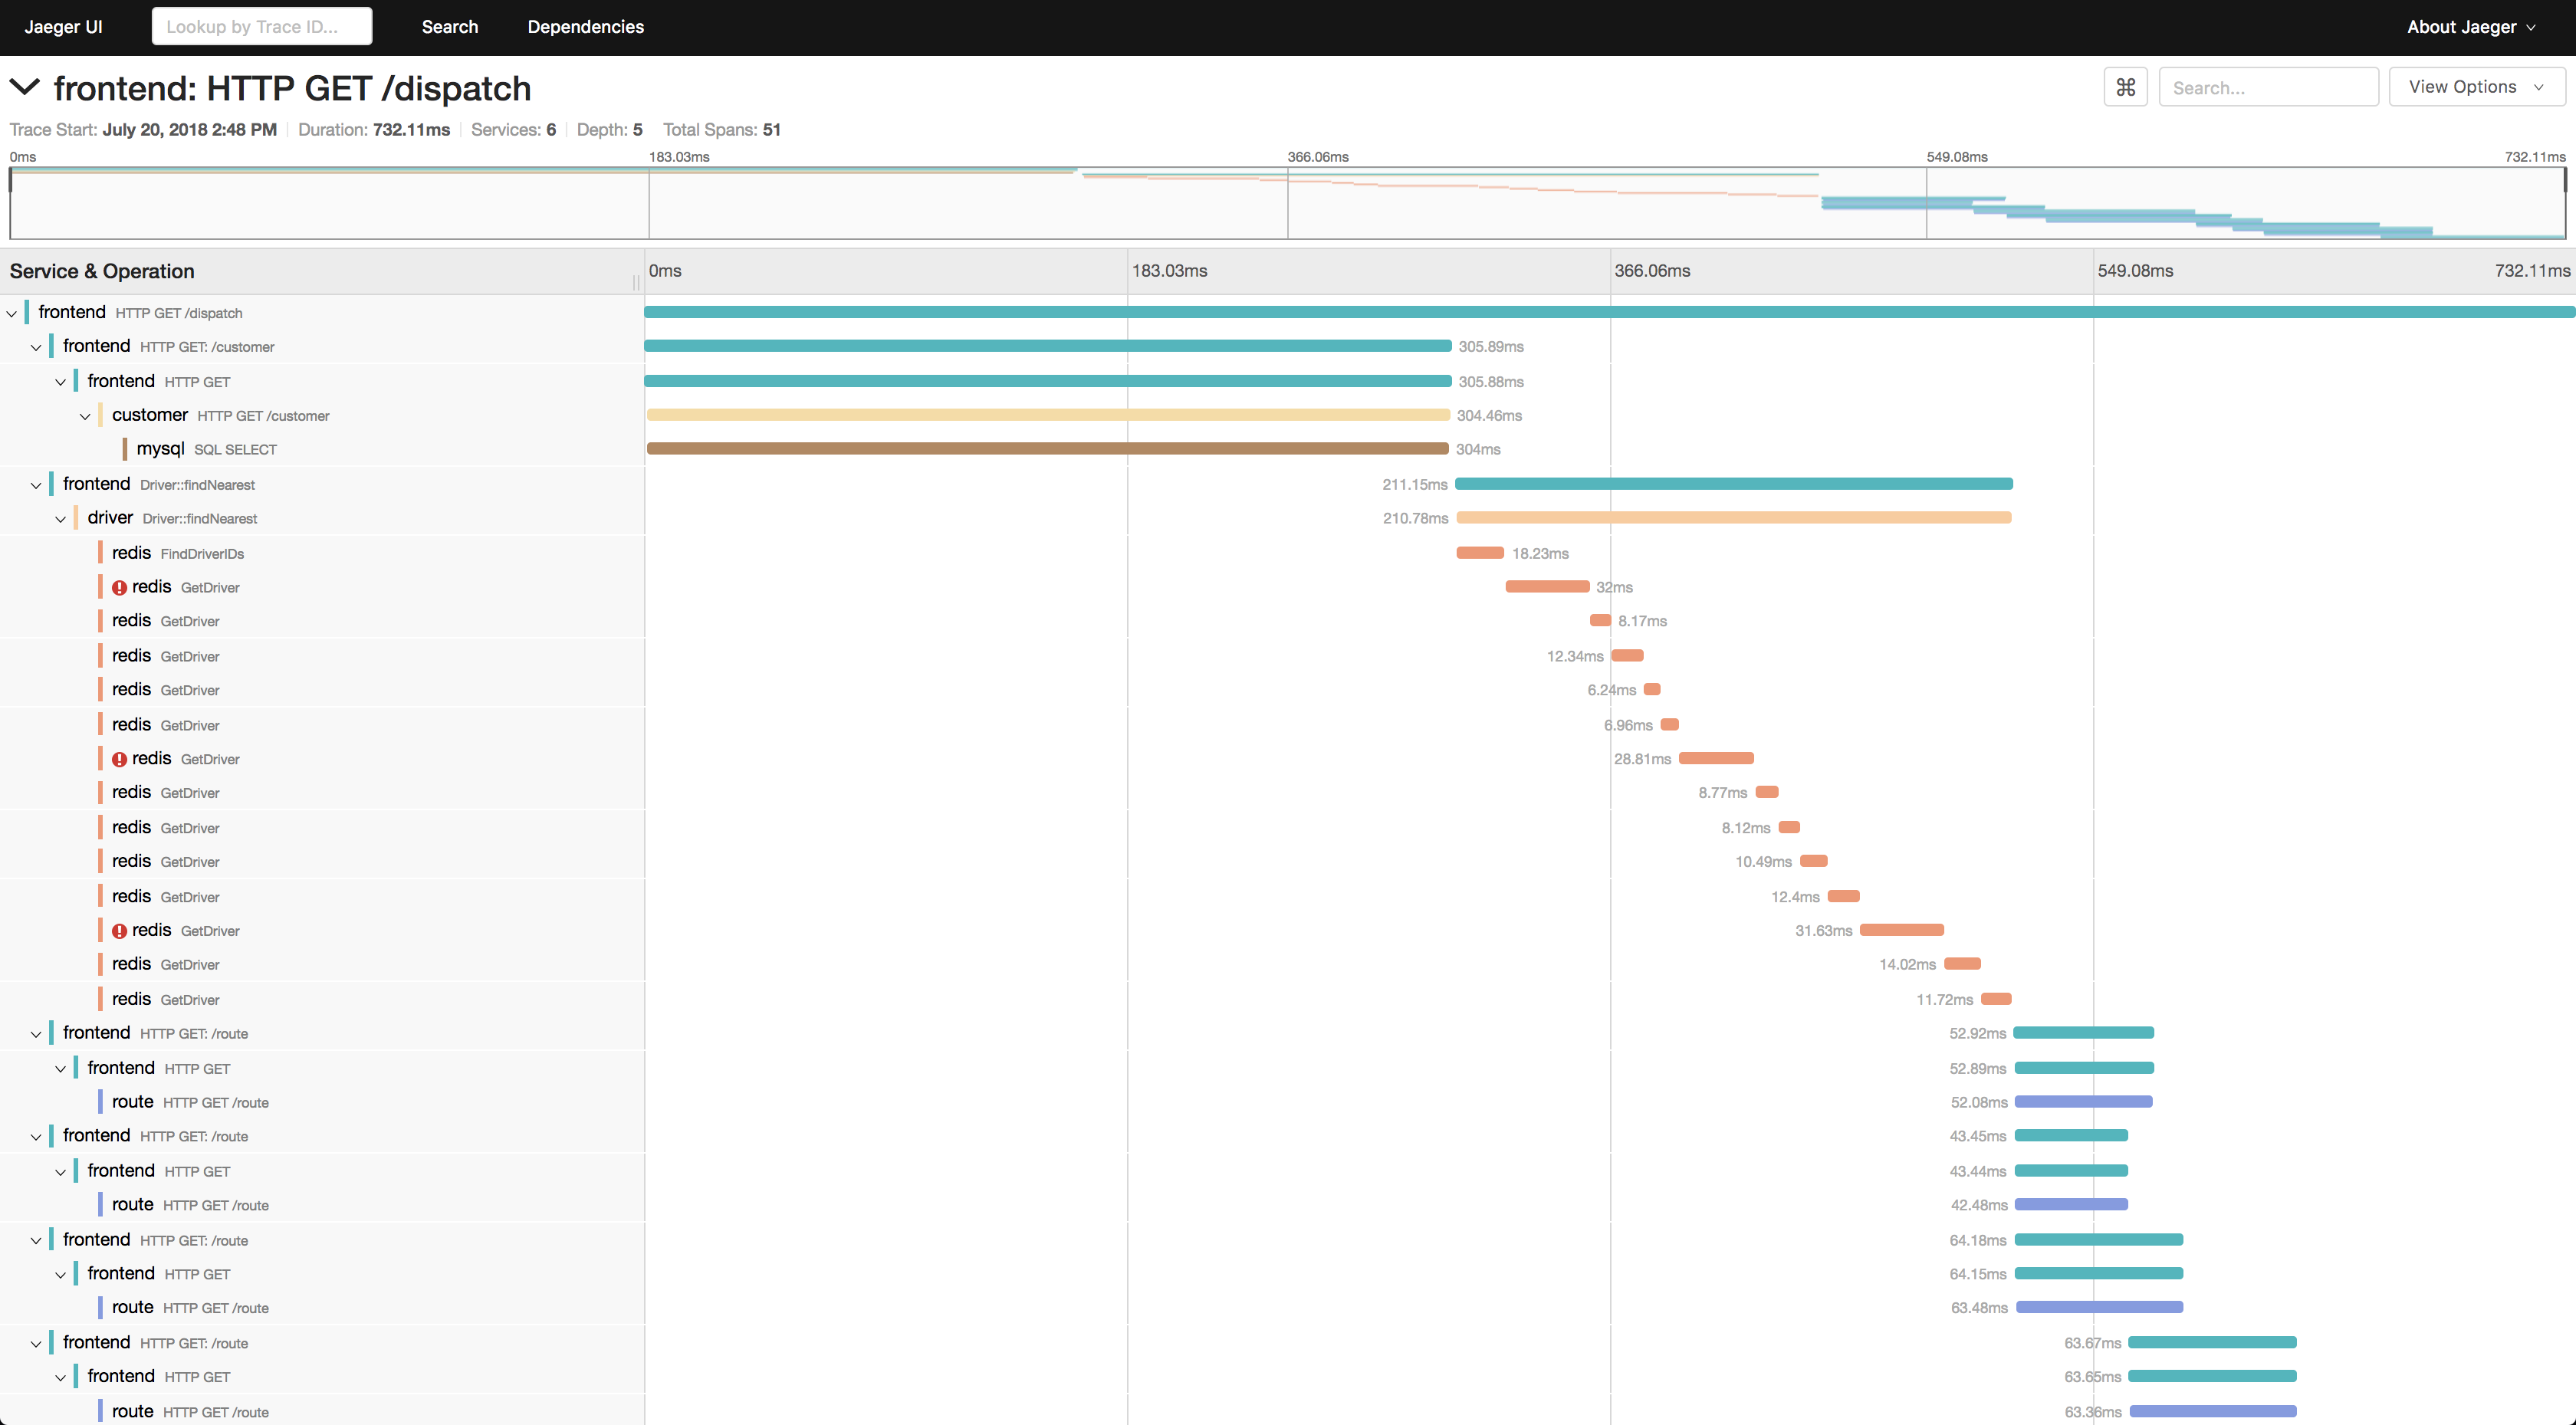
Source: Jaeger
5. OpenTelemetry

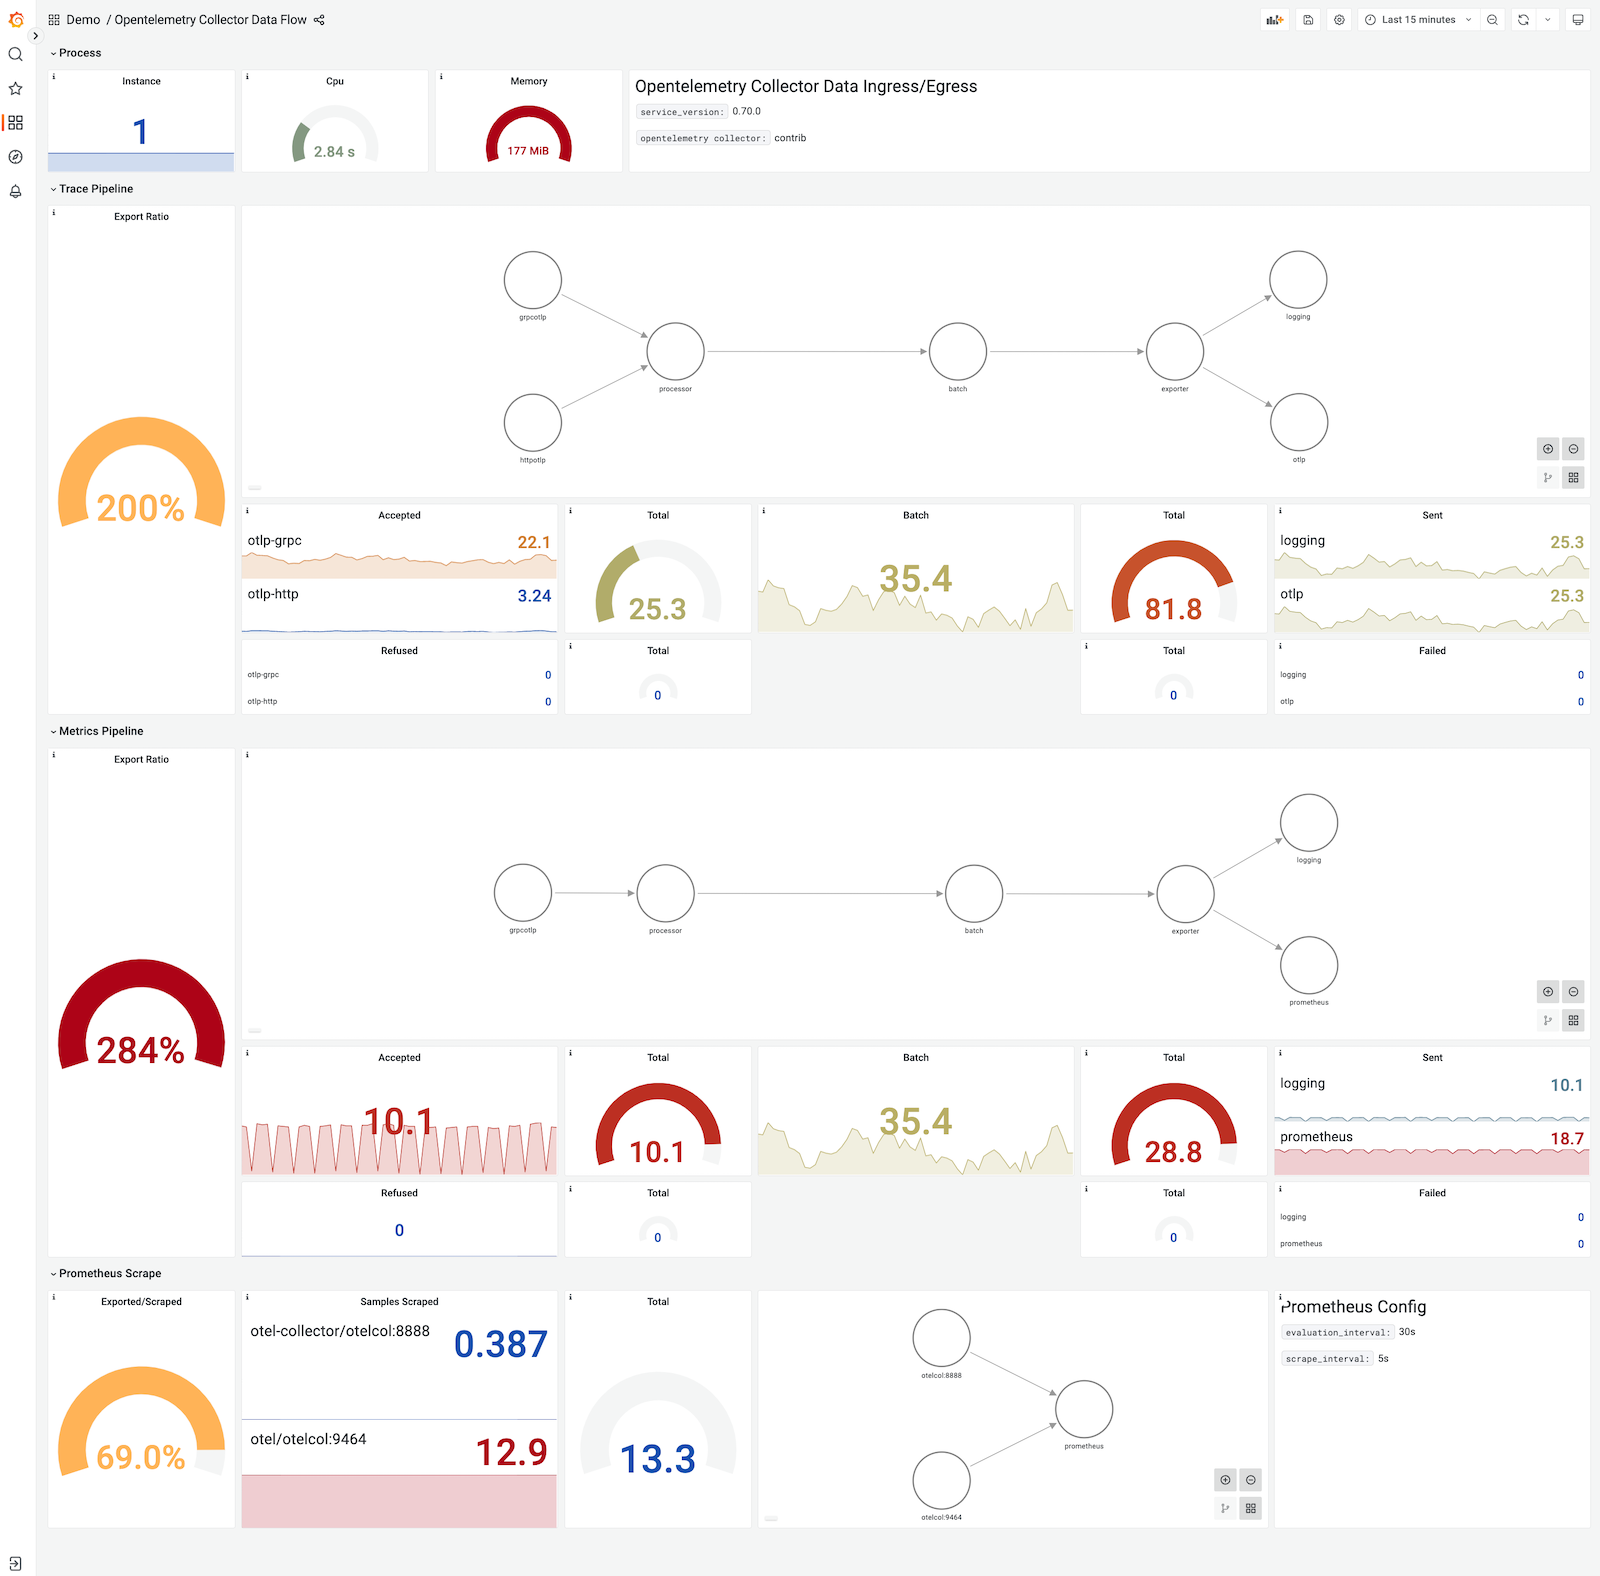
OpenTelemetry is an open-source observability framework to collect and export telemetry data from cloud-native systems. It provides standardized APIs, SDKs, agents, and collectors to capture metrics, logs, and distributed traces from applications. Because it is vendor-neutral, telemetry collected with OpenTelemetry can be sent to different observability backends without modifying application code.
License: Apache License 2.0
Repository: https://github.com/open-telemetry/opentelemetry-operator
GitHub stars: 1.6K
Contributors: 250+
Key features include:
- Vendor-neutral instrumentation: Applications can be instrumented once and export telemetry data to different monitoring backends.
- Unified observability signals: Supports the collection and correlation of traces, metrics, and logs.
- Collector-based data pipeline: Uses a collector service to receive, process, and export telemetry data.
- Automatic instrumentation support: Enables telemetry collection without modifying application source code for many frameworks.
- Multi-language SDK support: Provides native libraries for many programming languages including Java, Python, Go, and JavaScript.
Source: OpenTelemetry
6. OpenObserve

OpenObserve is an open-source observability platform to handle logs, metrics, and traces at large scale. It provides a unified system for storing and analyzing telemetry data from modern cloud-native environments such as Kubernetes. The platform uses a scalable architecture and columnar storage to support large data volumes while maintaining query performance.
License: AGPL 3.0
Repository: https://github.com/openobserve/openobserve
GitHub stars: 18.1K
Contributors: 100+
Key features include:
- Unified observability platform: Collects and analyzes logs, metrics, and traces within a single system.
- Open-source architecture: Fully open-source codebase that allows customization and independent deployment.
- Standards-based integration: Compatible with industry standards such as OpenTelemetry for telemetry collection.
- Scalable storage architecture: Uses columnar storage formats and distributed architecture to handle large data volumes.
- Flexible storage options: Supports multiple storage backends including local storage and object storage systems.
7. Checkmk
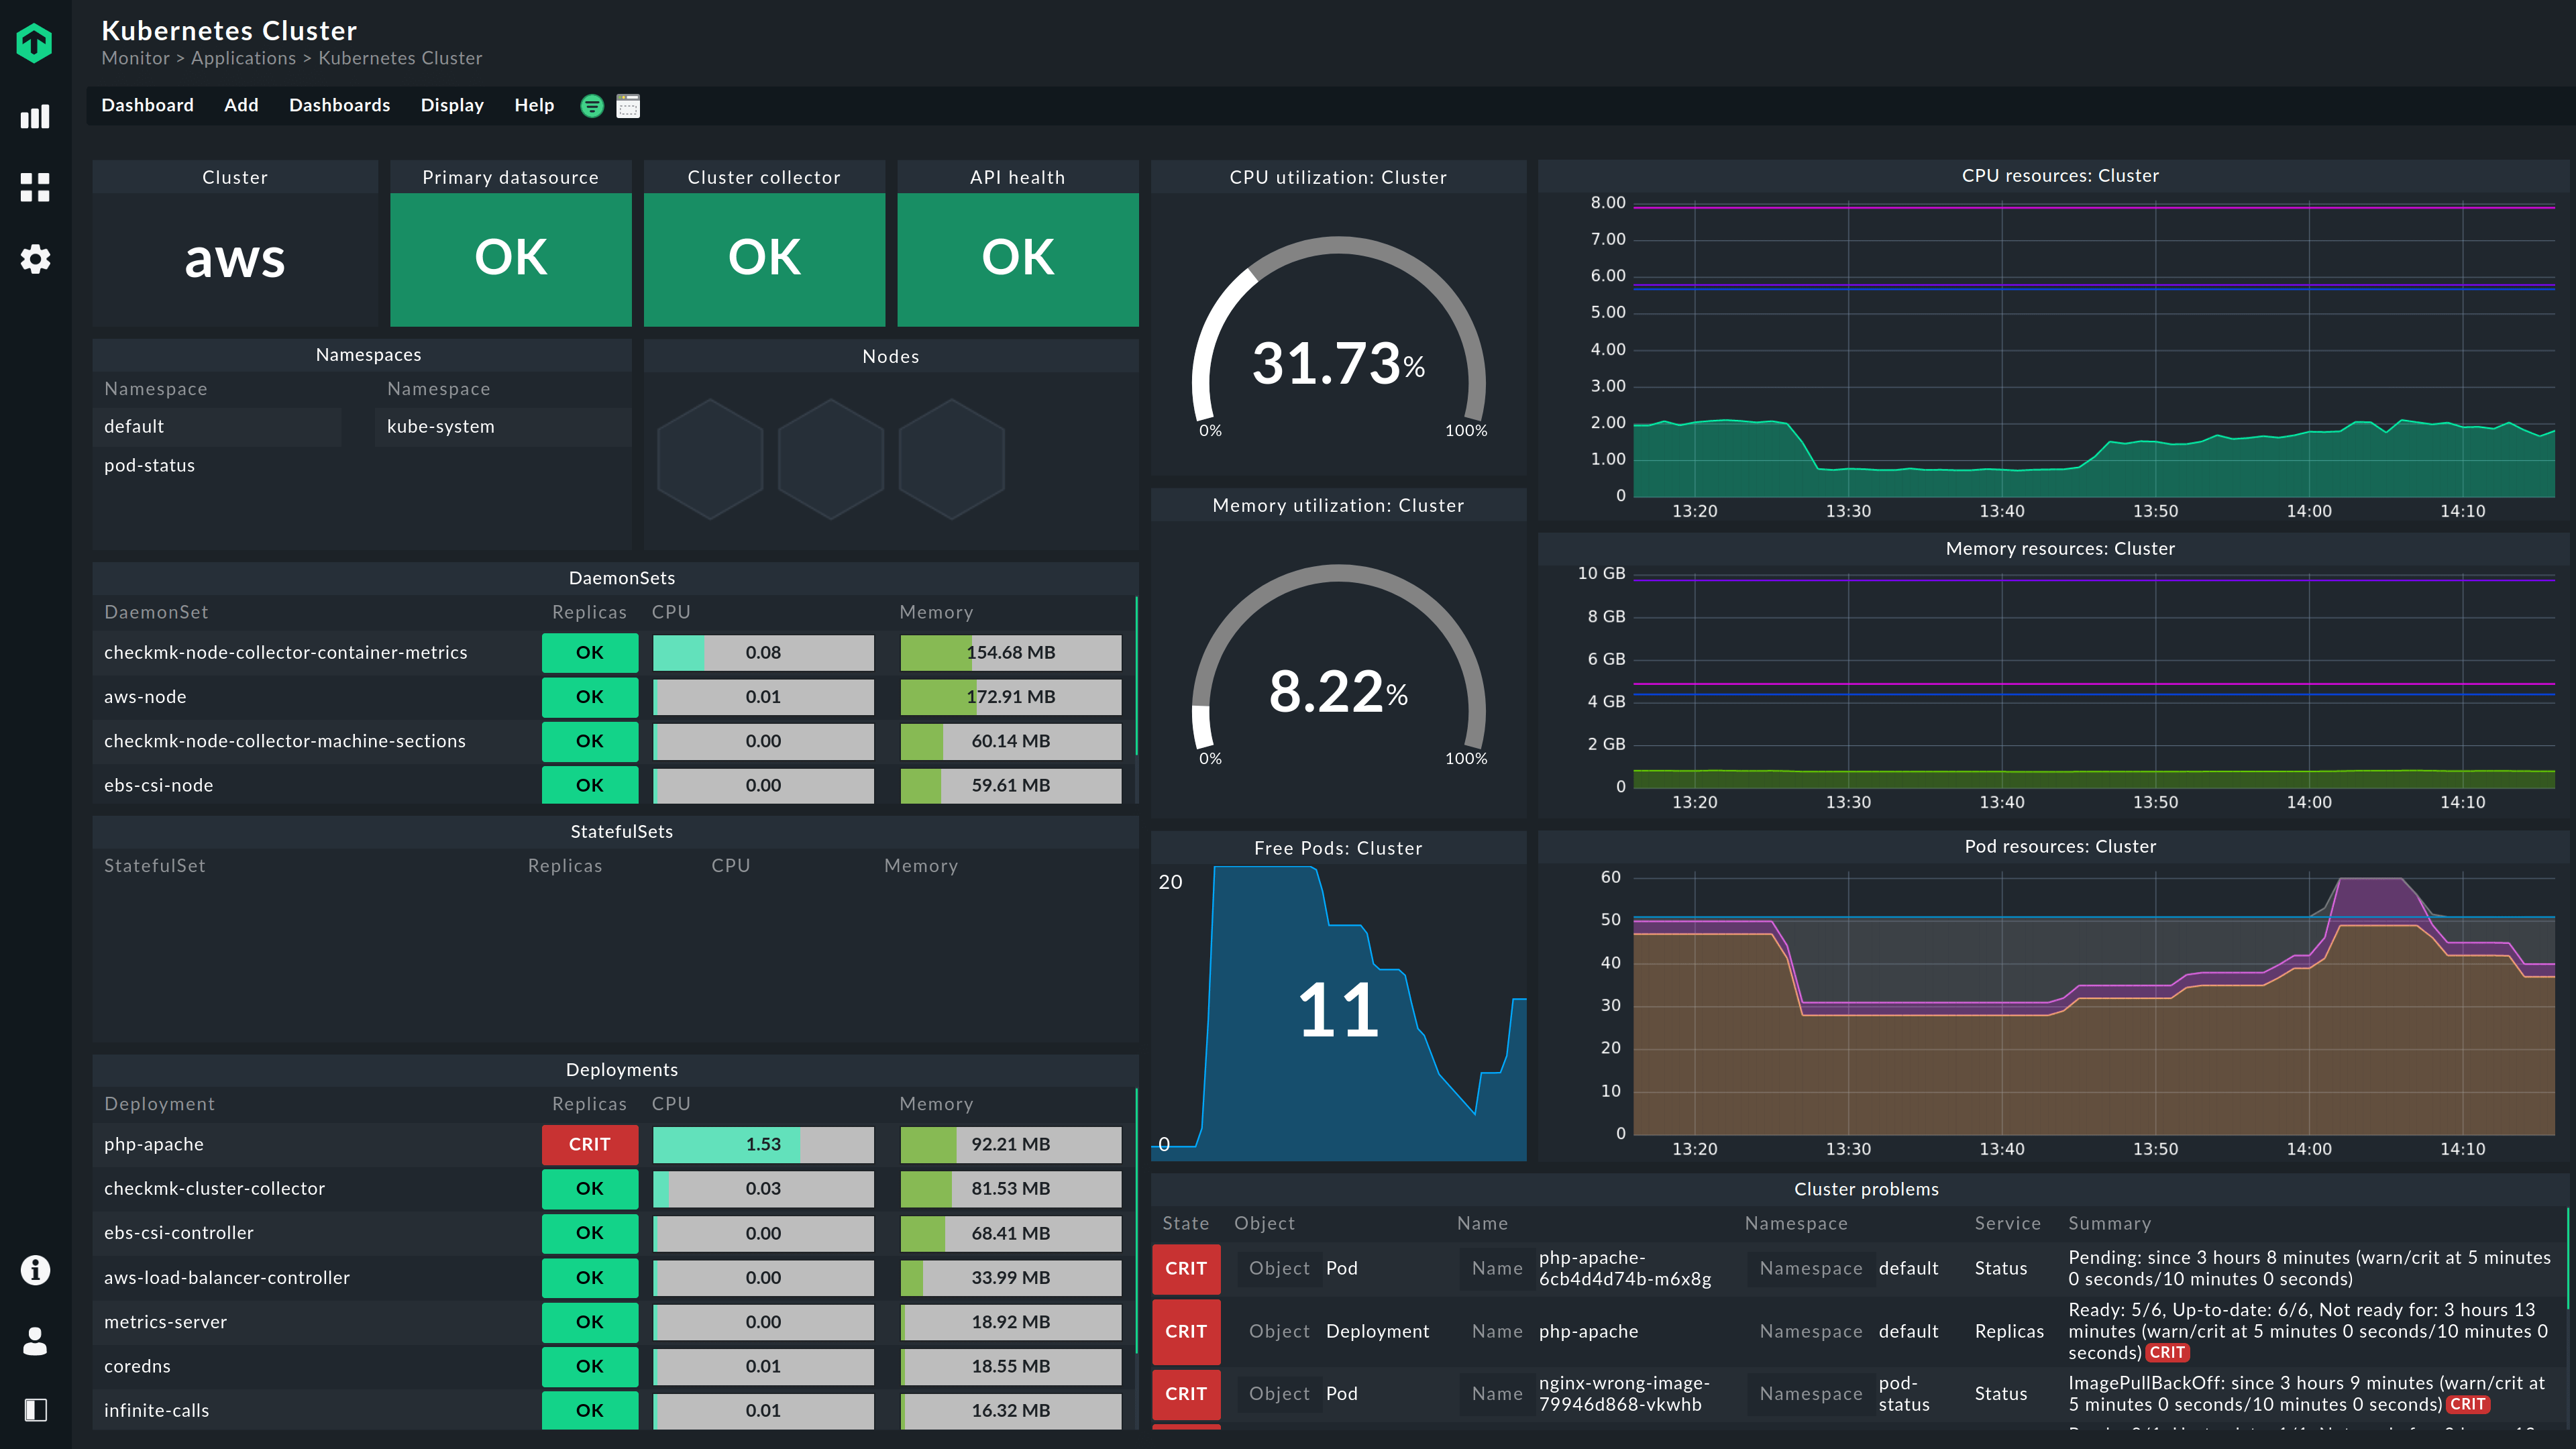
Checkmk is an IT monitoring platform that provides visibility across infrastructure environments, including Kubernetes clusters. It collects and analyzes performance data from infrastructure components, containers, and services to help operations teams monitor system health and diagnose issues. The platform uses automation features and distributed monitoring architecture to manage large-scale environments.
License: GPL 2.0
Repository: https://github.com/Checkmk/checkmk
GitHub stars: 2.2K
Contributors: 250+
Key features include:
- Comprehensive infrastructure monitoring: Monitors cloud environments, containers, servers, and networks from a unified platform.
- Large plugin ecosystem: Provides thousands of monitoring plugins for collecting metrics from different technologies.
- Automated discovery and configuration: Automatically detects hosts and services to reduce manual setup.
- Distributed monitoring architecture: Scales across many systems and environments while maintaining performance.
- Extensibility through APIs: Allows users to build custom monitoring plugins and extend the platform’s capabilities.
Source: Checkmk
8. SigNoz

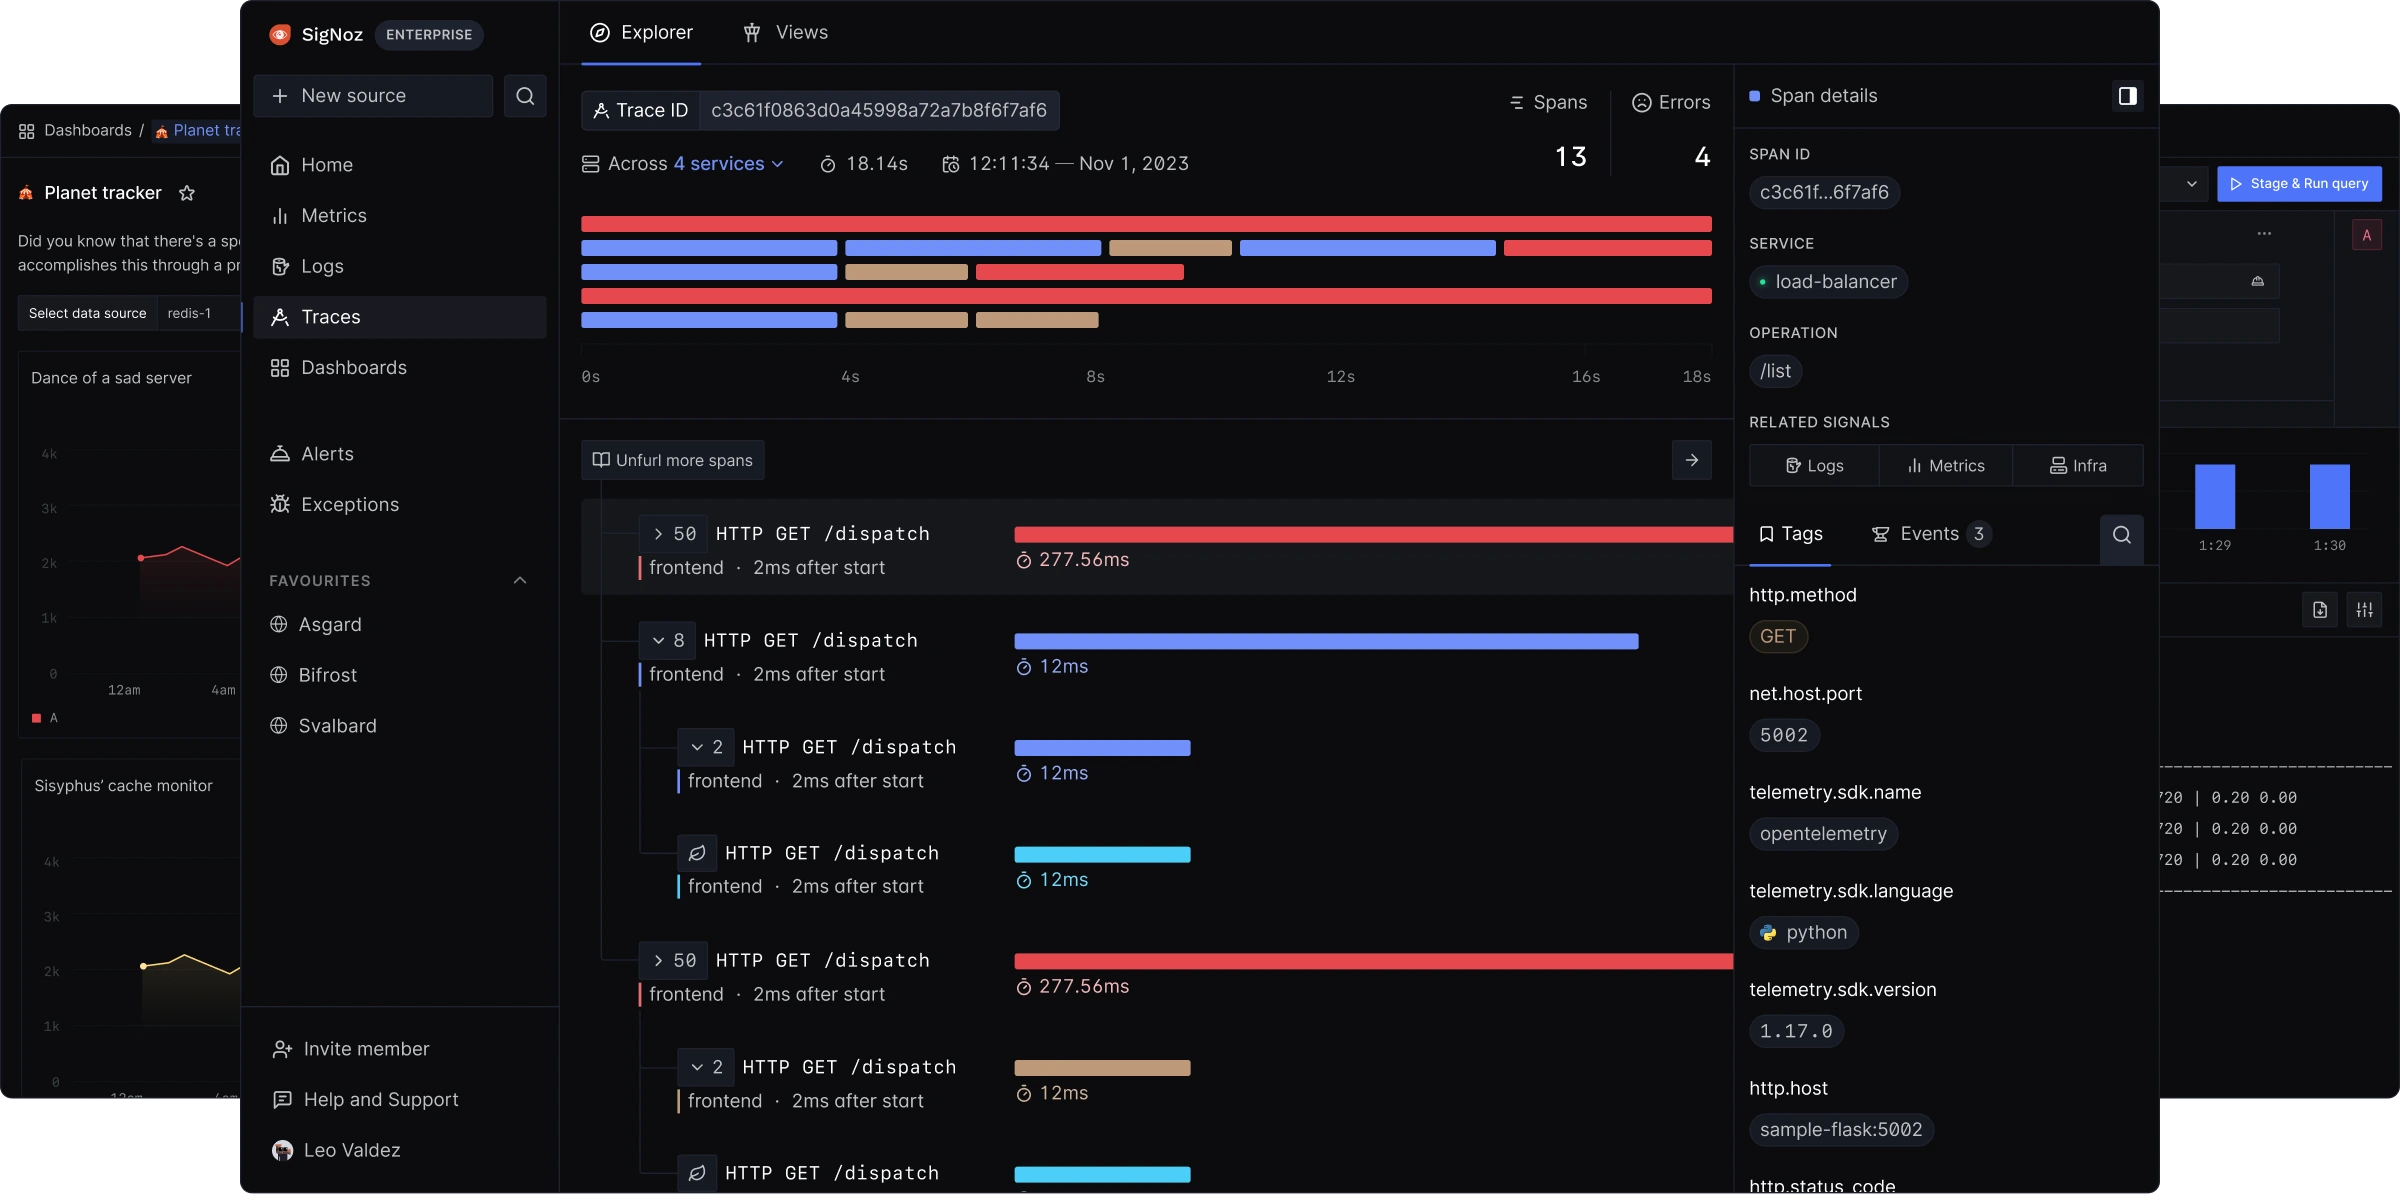
SigNoz is an open-source observability platform to monitor applications and infrastructure using logs, metrics, and traces. It is built to work natively with OpenTelemetry, allowing organizations to collect telemetry data from distributed systems without relying on proprietary instrumentation. SigNoz provides dashboards, alerting, and tracing capabilities to help teams investigate system behavior and diagnose performance issues.
License: MIT Expat, other
Repository: https://github.com/SigNoz/signoz
GitHub stars: 26K
Contributors: 200+
Key features include:
- Unified observability platform: Combines metrics, logs, traces, dashboards, and alerts within a single system.
- OpenTelemetry-native architecture: Uses OpenTelemetry for telemetry collection and standardized instrumentation.
- Flexible deployment options: Can be self-hosted, deployed in the cloud, or used in hybrid environments.
- High-performance storage engine: Uses ClickHouse as a columnar datastore optimized for large observability datasets.
- Correlated telemetry analysis: Links logs, metrics, and traces together to provide richer context during debugging.
Source: SigNoz
Conclusion
Kubernetes observability software plays a critical role in managing the complexity of distributed systems. By offering insights through metrics, logs, traces, and events, these tools help teams detect performance issues, analyze system behavior, and maintain cluster health. Effective observability enables faster troubleshooting, improved reliability, and better resource optimization across dynamic cloud-native environments.