






What are Kubernetes Monitoring Tools?
Kubernetes monitoring tools help you gain visibility into your containers, pods, and clusters. Monitoring tools help you ensure reliability and troubleshoot issues as they occur, monitor and enforce security, manage costs, fine-tune performance, and minimize chargebacks.
Monitoring is especially important in a containerized environment, because resources are ephemeral, the environment is complex, and it can be difficult to identify and troubleshoot problems.
Traditional monitoring tools are typically not effective in a containerized environment. A new generation of cloud native monitoring tools has emerged—these tools can be deployed as part of Kubernetes clusters and are able to gather relevant metrics from across the Kubernetes environment.
Editor’s note: Updated the article to include recent Kubernetes monitoring market trends, updated information for Kubernetes monitoring tools to reflect features and capabilities in 2026, and added one new tool.
In this article, you will learn:
- Kubernetes Monitoring Trends
- 5 Reasons Kubernetes Monitoring is Important
- Top 7 Open-Source Kubernetes Monitoring Tools
Kubernetes Monitoring Trends
Recent years have seen Kubernetes monitoring evolve rapidly from basic metrics collection to full-stack observability platforms. Key trends shaping Kubernetes monitoring include:
- Shift from monitoring to full observability – Modern approaches combine metrics, logs, and traces into unified platforms, enabling teams to correlate events across distributed systems instead of analyzing siloed data.
- OpenTelemetry becoming the standard – OpenTelemetry is now widely adopted as a vendor-neutral framework for collecting telemetry data, helping standardize instrumentation across tools and environments.
- AI-driven and AIOps capabilities – Monitoring tools increasingly use machine learning for anomaly detection, root cause analysis, and predictive alerts, reducing alert fatigue and improving incident response times.
- eBPF-based deep visibility – eBPF technology enables low-overhead, kernel-level monitoring without requiring agents inside containers, providing richer insights into network traffic and system behavior.
- Cost-aware observability – As Kubernetes environments scale, organizations are prioritizing cost monitoring and optimization, integrating tools that track resource usage and cloud spending alongside performance metrics.
- Multi-cluster and hybrid cloud monitoring – With workloads spread across multiple clusters, regions, and cloud providers, monitoring solutions are evolving to provide unified visibility across distributed environments.
- Security-first monitoring (DevSecOps integration) – Observability platforms increasingly incorporate security signals, enabling detection of anomalies, misconfigurations, and suspicious activity within clusters.
- Shift-left observability and automation – Monitoring is being integrated earlier into the CI/CD pipeline, with dashboards, alerts, and instrumentation defined as code to support faster and more reliable deployments.
Together, these trends reflect a move toward intelligent, automated, and unified observability systems that can handle the scale and complexity of modern Kubernetes environments.
5 Reasons Kubernetes Monitoring is Important
Here are several reasons your organization needs a robust monitoring strategy for Kubernetes:
- Reliability and troubleshooting – Kubernetes applications, especially those that use cloud-native or microservices architectures, can be particularly complex. If issues occur, it can be difficult to pinpoint the cause of the problem. With proper Kubernetes monitoring you can see where problems occur or are about to occur, and access data that can help you take action to prevent or fix the issue.
- Kubernetes performance tuning – Understanding what’s happening in your Kubernetes cluster can help you optimize hardware without compromising application performance.
- Cost management – When running Kubernetes on a public cloud infrastructure, it is important to keep track of how many nodes (compute instances) you are running, because this number will determine your hourly cost. Even if you are not running on a public cloud, it is important to know if your resources are exhausted or underutilized.
- Chargebacks – In some cases, you may want to know which groups are using which resources. Kubernetes monitoring can provide insights into usage statistics, which you can leverage to analyze chargebacks and showbacks or perform a general Kubernetes cost analysis.
- Security – In today’s threat environment, it is critical to know what is running and where, discover pods, containers or jobs that should not exist, and look for malicious ingress and egress traffic. Kubernetes monitoring is an essential part of a container security strategy.
Monitoring signals feed directly into Kubernetes security, which covers protecting clusters, workloads, and network traffic end to end.
Top 7 Open-Source Kubernetes Monitoring Tools
The following open-source tools are at the forefront of cloud-native monitoring technology. Let’s briefly review their features and capabilities.
1. Calico by Tigera
Calico is an open-source Kubernetes networking platform, which provides powerful monitoring and observability features:
- Network policy enforcement: Uses Kubernetes-native and extended network policies to control traffic between pods and services, enabling fine-grained segmentation.
- Real-time traffic visibility: Provides flow logs and metrics that show how traffic moves between workloads, namespaces, and external endpoints.
- Workload-level observability: Tracks communication at the pod and service level, helping identify unexpected connections or misconfigurations.
- Security monitoring: Detects anomalous or unauthorized network activity, supporting threat detection and compliance requirements.
- Scalable data plane: Uses eBPF or iptables for efficient packet processing with minimal performance overhead in large clusters.
- Integration with Prometheus and Grafana: Exposes metrics that can be scraped and visualized for monitoring and alerting.
- Multi-cluster and hybrid support: Enables consistent networking and observability across multiple clusters and cloud environments.
In addition, Calico Cloud and Calico Enterprise, commercial offerings provided on top of open source Calico, offer the following advanced features for Kubernetes observability:
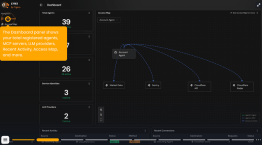
- Dynamic Service Graph – A point-to-point, topographical representation of traffic flow and policy that shows how workloads within the cluster are communicating, and across which namespaces. Also includes advanced capabilities to filter resources, save views, and troubleshoot service issues.
- DNS Dashboard – Helps accelerate DNS-related troubleshooting and problem resolution in Kubernetes environments by providing an interactive UI with exclusive DNS metrics.
- L7 Dashboard – Provides a high-level view of HTTP communication across the cluster, with summaries of top URLs, request duration, response codes, and volumetric data for each service.
- Dynamic Packet Capture – Captures packets from a specific pod or collection of pods with specified packet sizes and duration, in order to troubleshoot performance hotspots and connectivity issues faster.
- Application-level Observability – Provides a centralized, all-encompassing view of service-to-service traffic in the Kubernetes cluster to detect anomalous behavior like attempts to access applications or restricted URLs, and scans for particular URLs.
- Unified Controls – A single, unified management plane provides a centralized point-of-control for unified security and observability on multiple clouds, clusters, and distros. Users can monitor and observe across environments with a single pane of glass.
Learn more about Calico for Kubernetes monitoring and observability
2. Kubernetes Dashboard
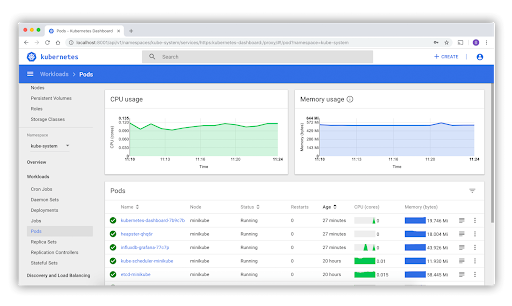
Kubernetes Dashboard is a web-based user interface for managing and monitoring Kubernetes clusters. It provides a graphical view of cluster resources, workloads, and application states, allowing administrators and developers to inspect running workloads and troubleshoot issues. The dashboard also allows users to deploy applications, scale resources, and manage Kubernetes objects through an interactive interface.
Key features include:
- Web-based cluster interface: Provides a graphical UI for viewing and managing Kubernetes clusters and resources.
- Workload management: Allows users to deploy applications, create deployments, and manage workloads such as Pods, ReplicaSets, and StatefulSets.
- Cluster resource overview: Displays nodes, namespaces, and storage resources with CPU and memory usage metrics.
- Application troubleshooting: Surfaces error states and provides visibility into application health and runtime issues.
- Integrated log viewer: Enables viewing container logs directly from the dashboard to assist with debugging.
GitHub repo: http://github.com/kubernetes/dashboard
3. Prometheus
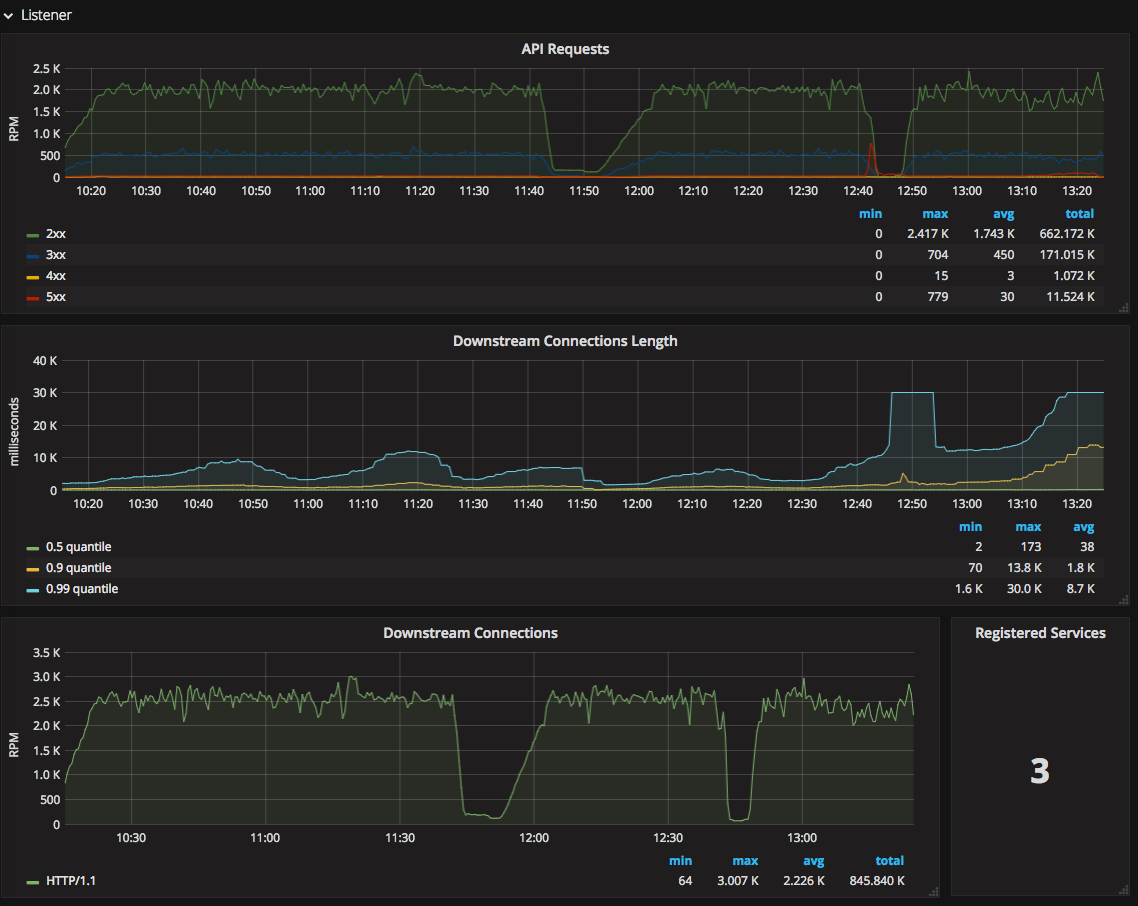
Prometheus is an open-source monitoring and alerting toolkit widely used for Kubernetes and cloud-native environments. It collects and stores metrics as time-series data and allows teams to query and analyze those metrics to understand system behavior. Prometheus is intended to operate reliably during outages and supports dynamic infrastructure common in microservices architectures.
Key features include:
- Time-series metrics model: Stores metrics with timestamps and labels, allowing flexible analysis of system behavior over time.
- PromQL query language: Provides a query language for analyzing metrics and creating alerts or dashboards.
- Pull-based metric collection: Retrieves metrics from monitored services over HTTP using a pull model.
- Service discovery support: Automatically discovers monitoring targets in dynamic environments.
- Standalone server architecture: Each Prometheus server operates independently without relying on distributed storage.
- Alert management integration: Supports alerting through tools such as Alertmanager when predefined conditions are triggered.
GitHub repo: http://github.com/prometheus/prometheus
4. Jaeger
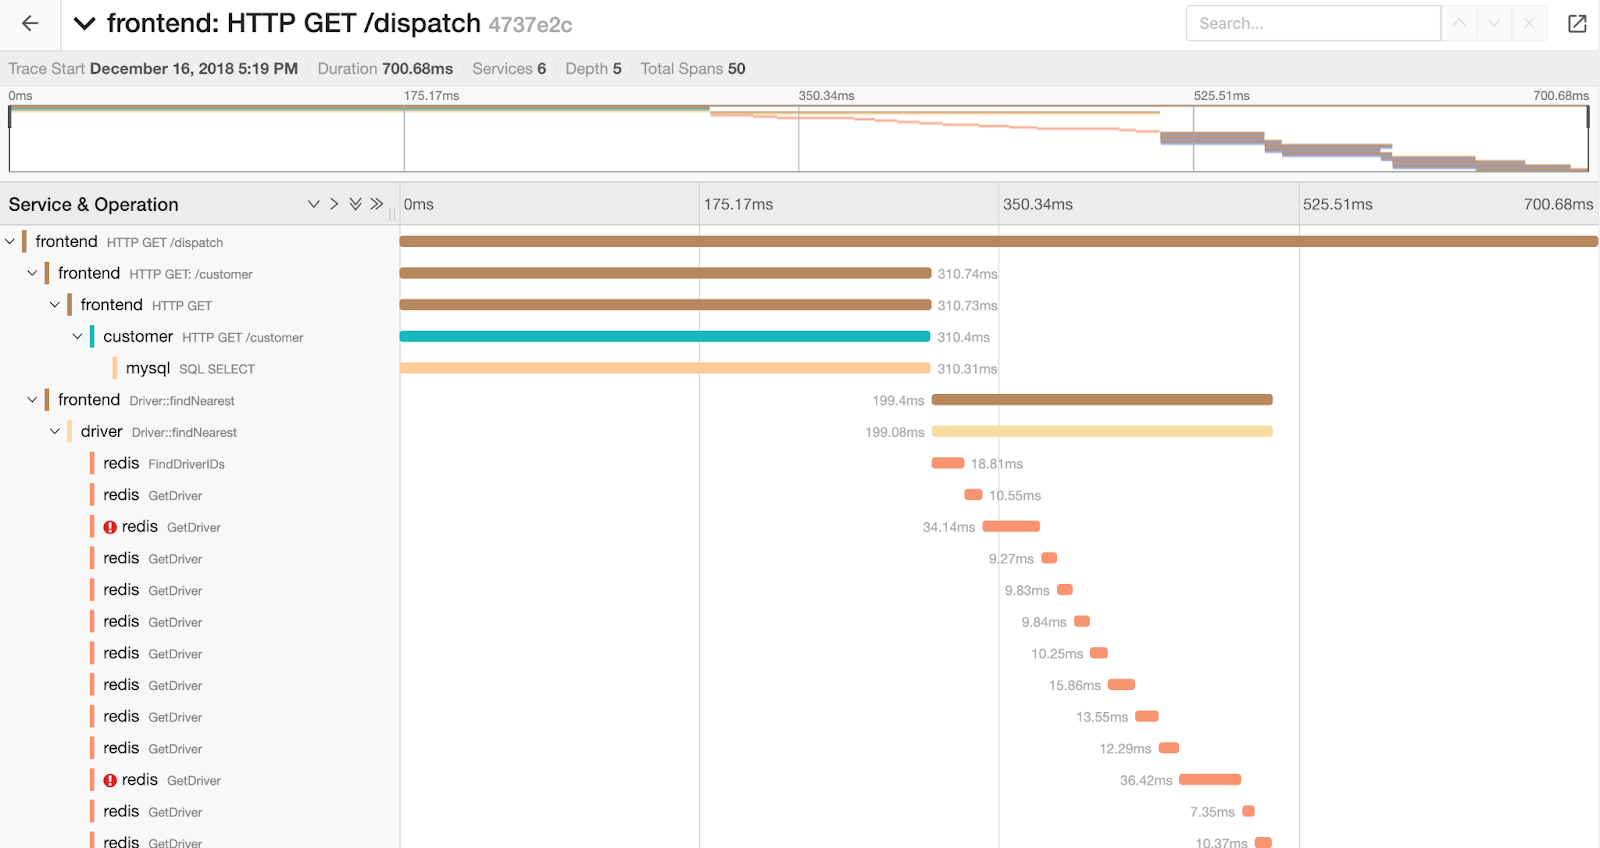
Jaeger is an open-source distributed tracing platform used to monitor and troubleshoot transactions in microservices architectures. It tracks how requests move through distributed services, allowing teams to visualize dependencies and identify bottlenecks or failures. Jaeger is particularly useful in environments where a single request may involve multiple services communicating across a network.
Key features include:
- Distributed tracing: Tracks requests across multiple services to visualize how transactions move through the system.
- Performance bottleneck detection: Helps identify latency issues and delays between services.
- Root cause analysis: Enables teams to locate the source of failures in complex service interactions.
- Service dependency analysis: Maps relationships between services to understand communication paths.
- Scalable cloud-native design: Built to operate in large distributed systems and microservices environments.
GitHub repo: http://github.com/jaegertracing/jaeger-kubernetes
5. Elastic Stack (ELK)
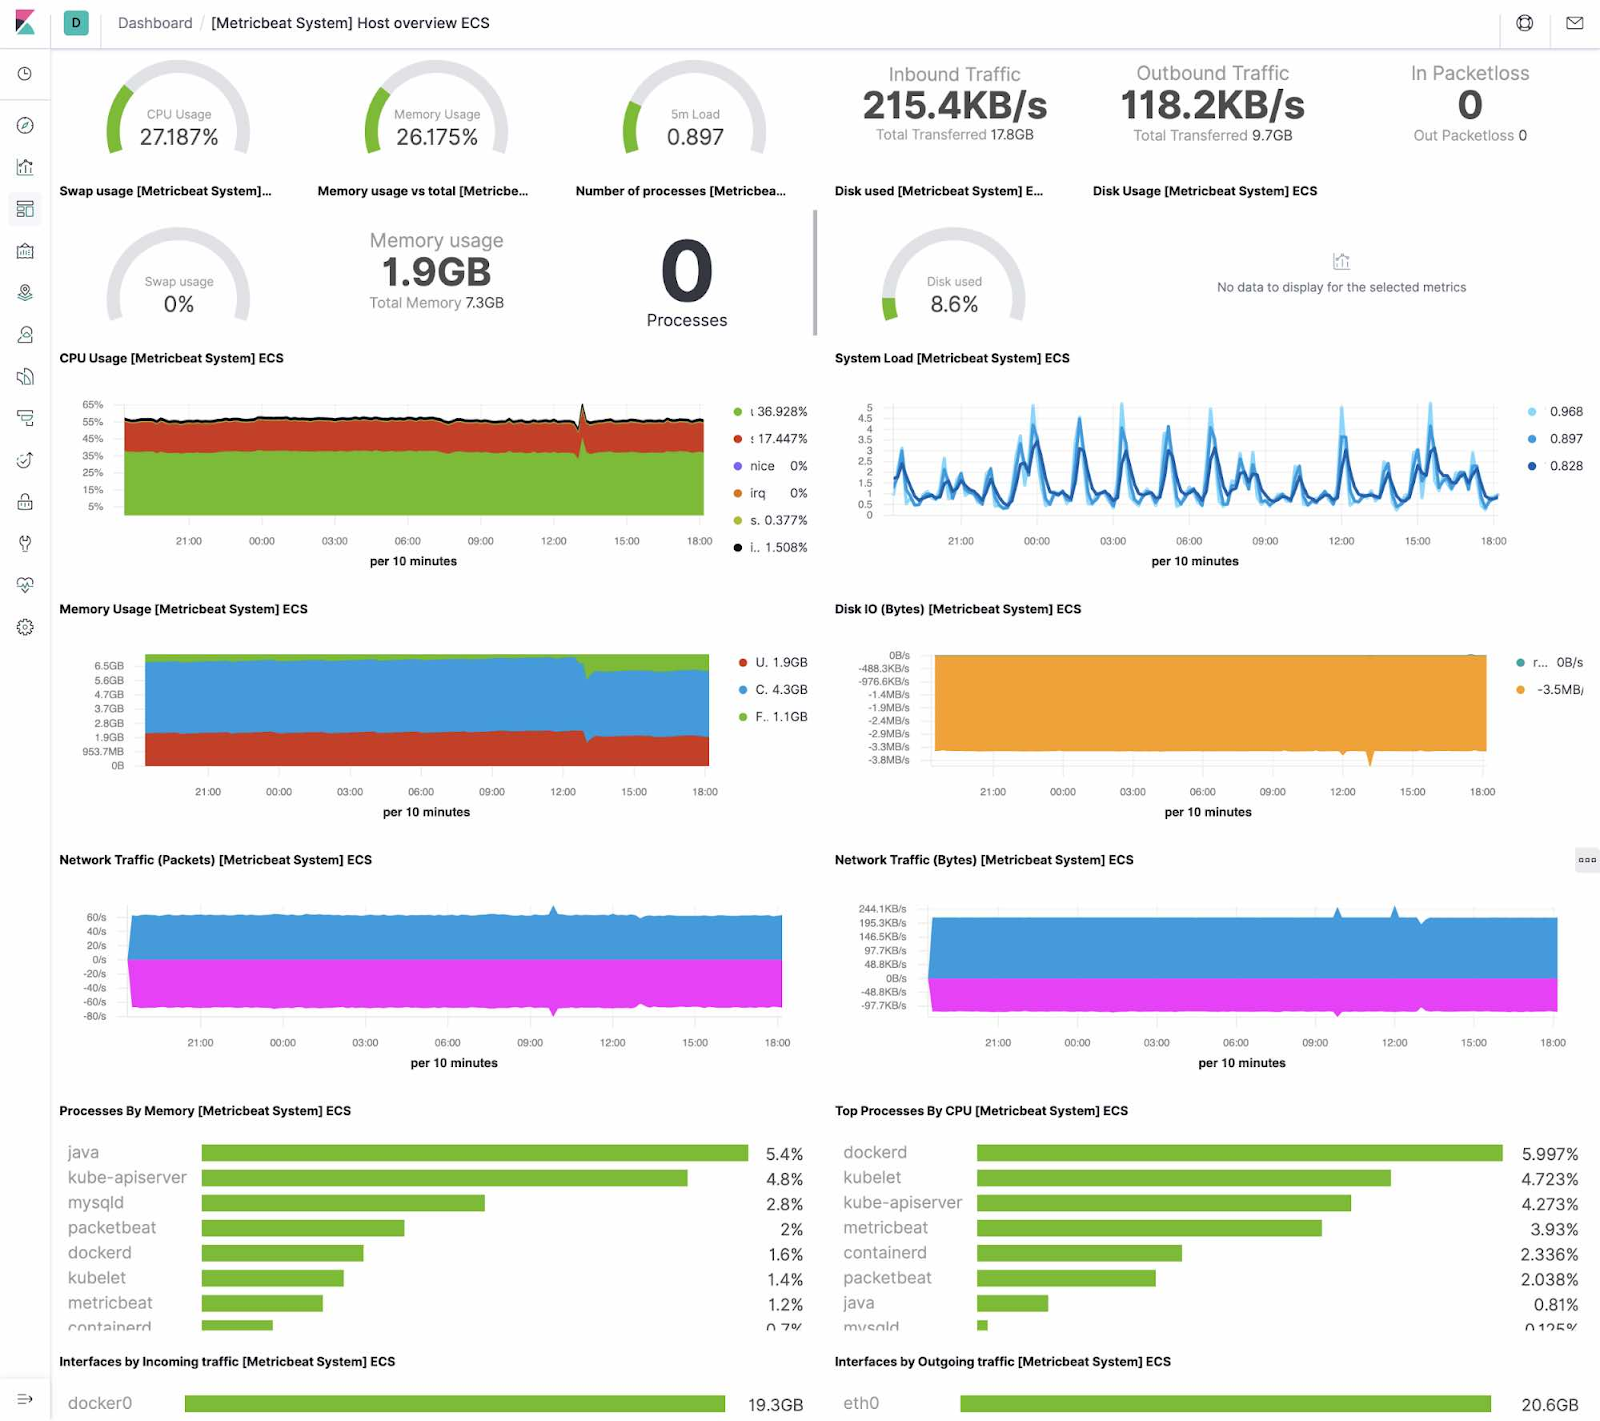
Elastic Stack, commonly referred to as ELK, is an open-source platform used for searching, analyzing, and visualizing large volumes of data, including logs and metrics from Kubernetes environments. By collecting data from multiple sources, ELK enables organizations to monitor application behavior, troubleshoot issues, and analyze operational trends.
Key features include:
- Elasticsearch analytics engine: Stores and analyzes structured and unstructured data at scale.
- Kibana visualization interface: Provides dashboards and visualizations to explore logs and metrics.
- Logstash data processing: Collects, transforms, and forwards log data to Elasticsearch for analysis.
- Flexible data ingestion: Supports multiple data sources and formats through integrations and agents such as Beats.
- Real-time data analysis: Enables searching and analyzing operational data as it is generated.
GitHub repo: http://github.com/deviantony/docker-elk
Related content: Read our guide to Kubernetes logging.
6. kubewatch
kubewatch is a Kubernetes monitoring utility that tracks changes in cluster resources and sends notifications to collaboration platforms. It watches for events affecting specific Kubernetes objects and alerts users through webhooks and messaging tools. This approach allows teams to respond quickly when changes occur within the cluster.
Key features include:
- Kubernetes event monitoring: Watches cluster resources and detects changes in objects such as pods, services, or deployments.
- Notification integrations: Sends alerts to messaging and collaboration platforms such as Slack, Microsoft Teams, and Mattermost.
- Webhook support: Allows event notifications to be forwarded through webhooks to external systems.
- Configurable resource tracking: Users can define which Kubernetes resources should trigger notifications.
- Prometheus metrics endpoint: Exposes operational metrics for monitoring kubewatch itself.
GitHub repo: http://github.com/bitnami-labs/kubewatch
7. cAdvisor
cAdvisor (Container Advisor) is an open-source tool for monitoring resource usage and performance of containers. It runs on each node and automatically discovers containers, collecting system metrics such as CPU, memory, network, and filesystem usage. The collected data can be used to understand container performance and capacity utilization in Kubernetes environments.
Key features include:
- Automatic container discovery: Detects containers running on a node without manual configuration.
- Resource usage monitoring: Tracks CPU, memory, network, and filesystem usage for containers.
- Node-level deployment: Runs on Kubernetes nodes to collect metrics from all containers on the host.
- Built-in Kubernetes integration: Included in Kubernetes through integration with the kubelet component.
- Prometheus metrics exposure: Provides metrics that can be easily consumed by Prometheus for further monitoring and analysis.
GitHub repo: http://github.com/google/cadvisor