Benefits
Quickly identify and troubleshoot service-level connectivity issues that impact cluster applications by leveraging the unique perspective provided by the Dynamic Service and Threat Graph
Live Dynamic view
Observe microservice activities and interactions within a Kubernetes cluster with a dynamic live view that helps identify and troubleshoot connectivity issues faster
Live troubleshooting
Identify, troubleshoot and apply fixes in live Kubernetes environments by analyzing traffic flows, network, and security policies simultaneously within the graph
Real-time insights
Get a real-time understanding of all upstream and downstream dependencies of microservices in a Kubernetes cluster and identify any performance hotspots and security gaps
Custom views
Build and save custom views that are tailored to specific use cases for quick reference and recall; leverage Layers to group and segment resources within a cluster to effectively manage scale
Shareable views
Standardize, save and share views tailored to your requirements at the platform, microservice, or application level for faster troubleshooting and easier onboarding for new team members
Kubernetes context-rich information
Leverage annotated graphs with Kubernetes context and performance metrics, such as status codes, latency, user agents, and URLs to speed up problem resolution across different teams
Capabilities
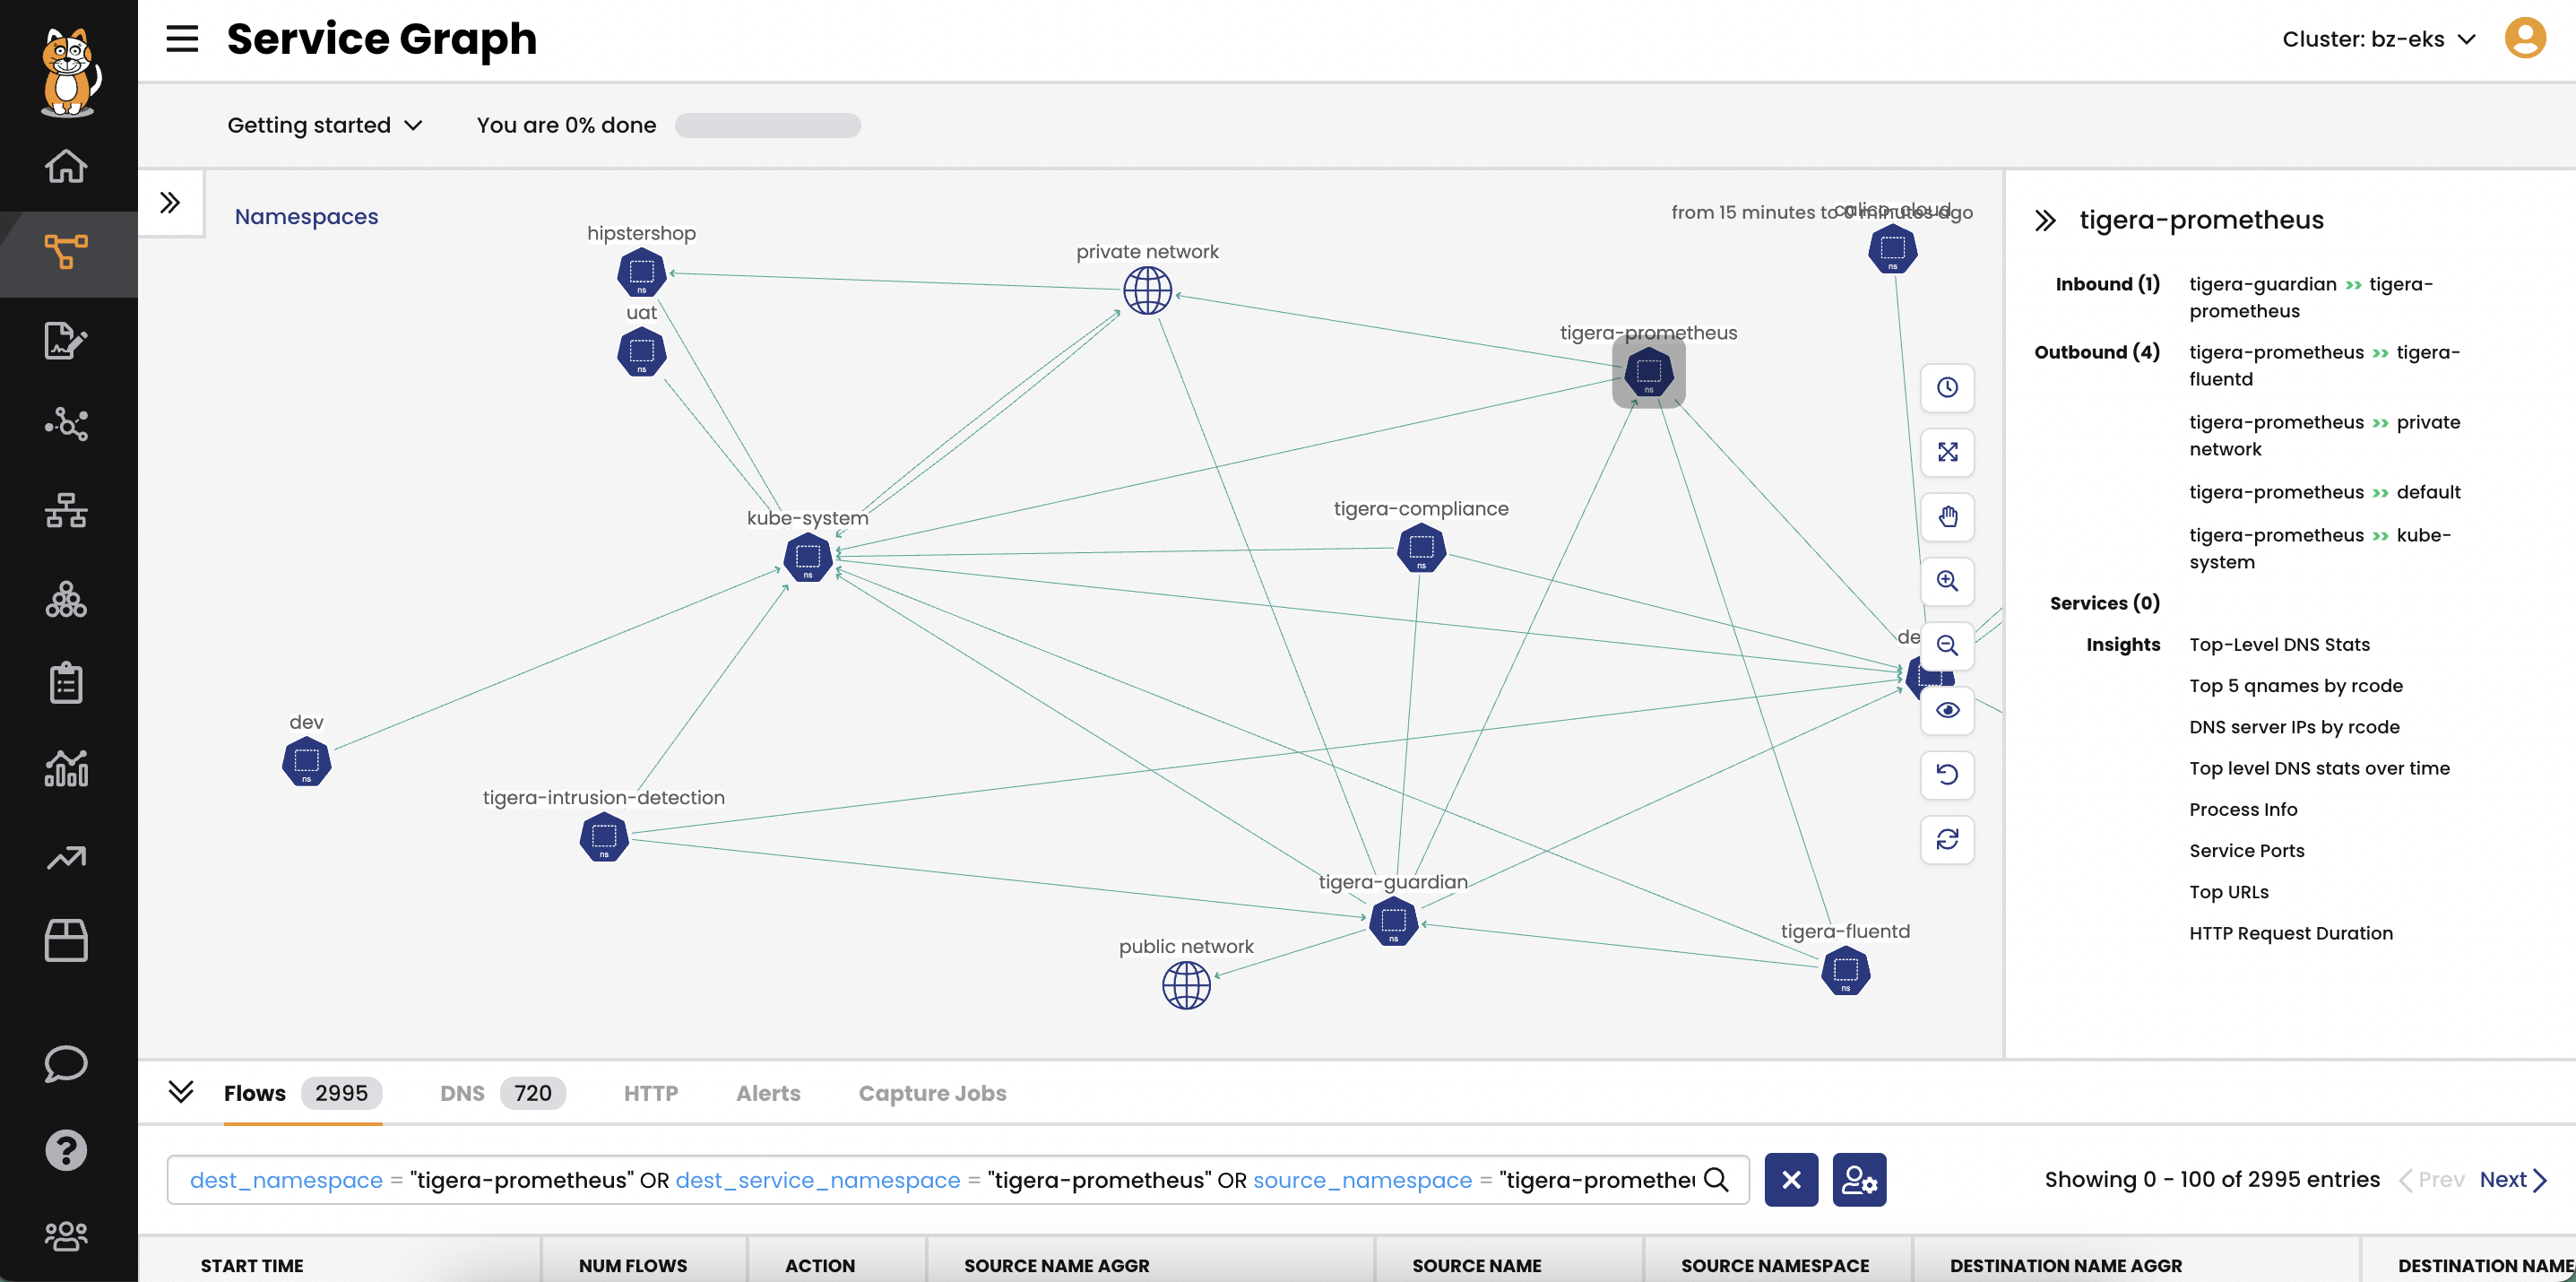
- Provides point-to-point, topographical representation of microservices within a cluster
- Displays how workloads, microservices within the cluster are communicating, and across which namespaces and pods
- Provides layers to group resources based on application developers’ and platform operators’ tailored views for their use case
- Provides metadata on ports, protocols, and how network and security policies are being evaluated
- Provides alerts that are annotated directly on the graph
- Includes advanced capabilities to filter resources and save views
- Includes an interactive graph to visualize microservice connections, the volume of connections, and connectivity

Webinar

Technical Blog
