Kubernetes workloads are highly dynamic, ephemeral, and are deployed on a distributed and agile infrastructure. Application developers, DevOps teams, and site reliability engineers (SREs) often require better visibility of their different microservices, what their dependencies are, how they are interconnected, and which other clients and applications access them. This makes Kubernetes observability challenges unique. While Kubernetes helps to meet the needs of deploying and managing distributed applications, its observability challenges require a Kubernetes-native approach.
Traditional monitoring and observability solutions create data silos by collecting data at different levels (e.g. infrastructure, cluster, and application levels), or from a large number of ephemeral objects that generate data across a distributed environment. Traditional monitoring and observability solutions then stitch this data together to provide a near real-time snapshot view. This approach is not scalable given the high volume of granular data generated at each level, as well as Kubernetes’ distributed nature. It also starts to become expensive and budget unfriendly to run traditional monitoring solutions, as they require higher resource consumption (high-performance memory, more compute, and higher bandwidth).
In contrast, a Kubernetes-native observability solution can visualize all information with all relationship context intact and provide a high-fidelity view of the environment. This shortens the time needed to troubleshoot an application inside Kubernetes, plays a big role in design decisions, workload placement, and resiliency, and won’t drive costs higher from a resource consumption perspective.
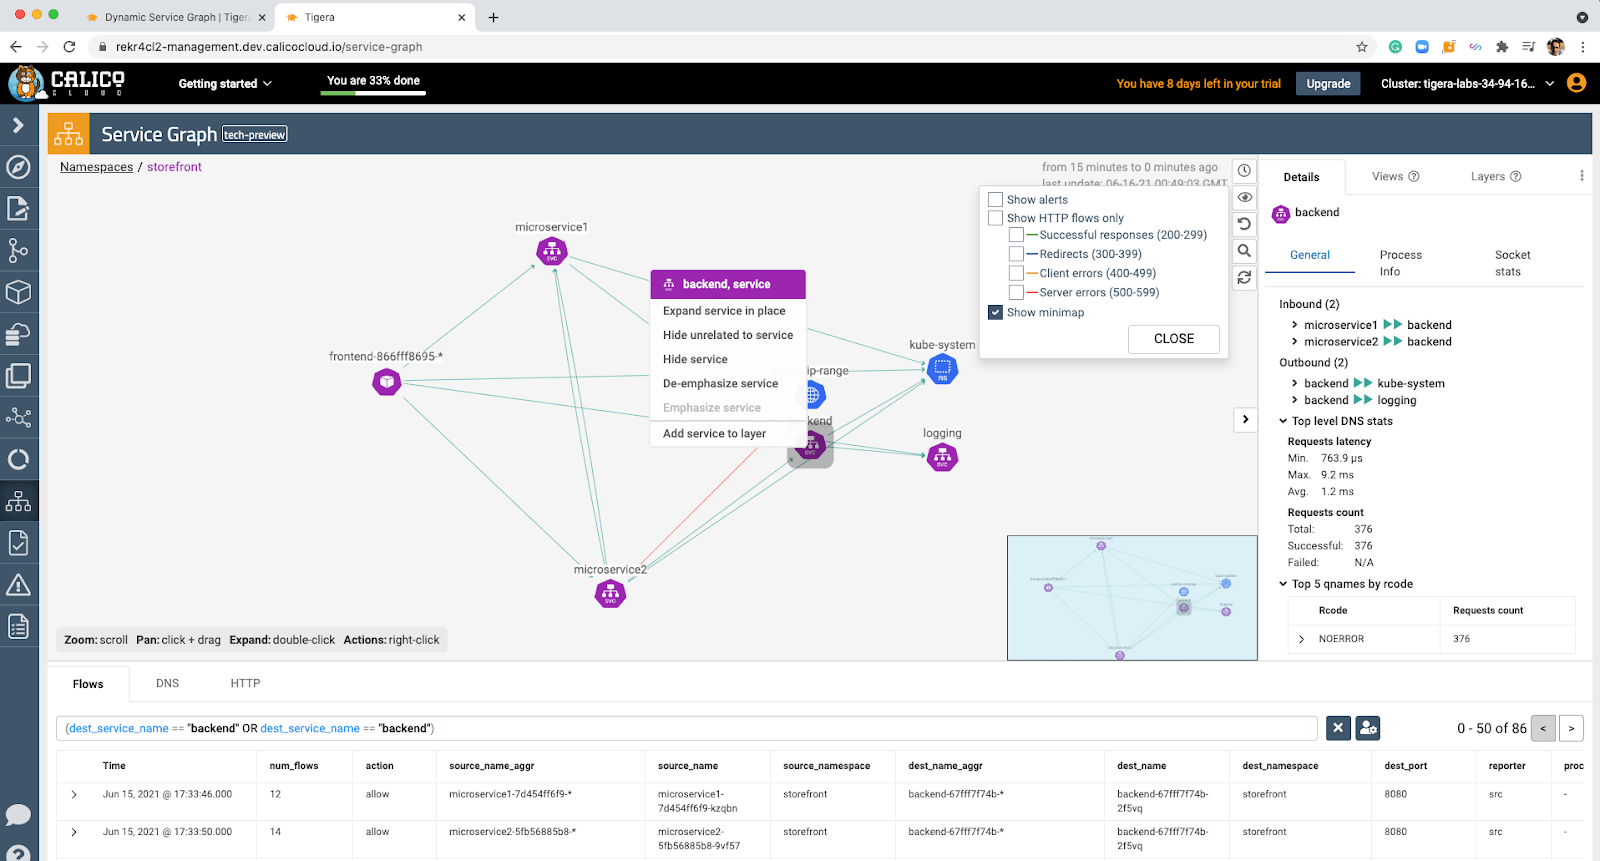
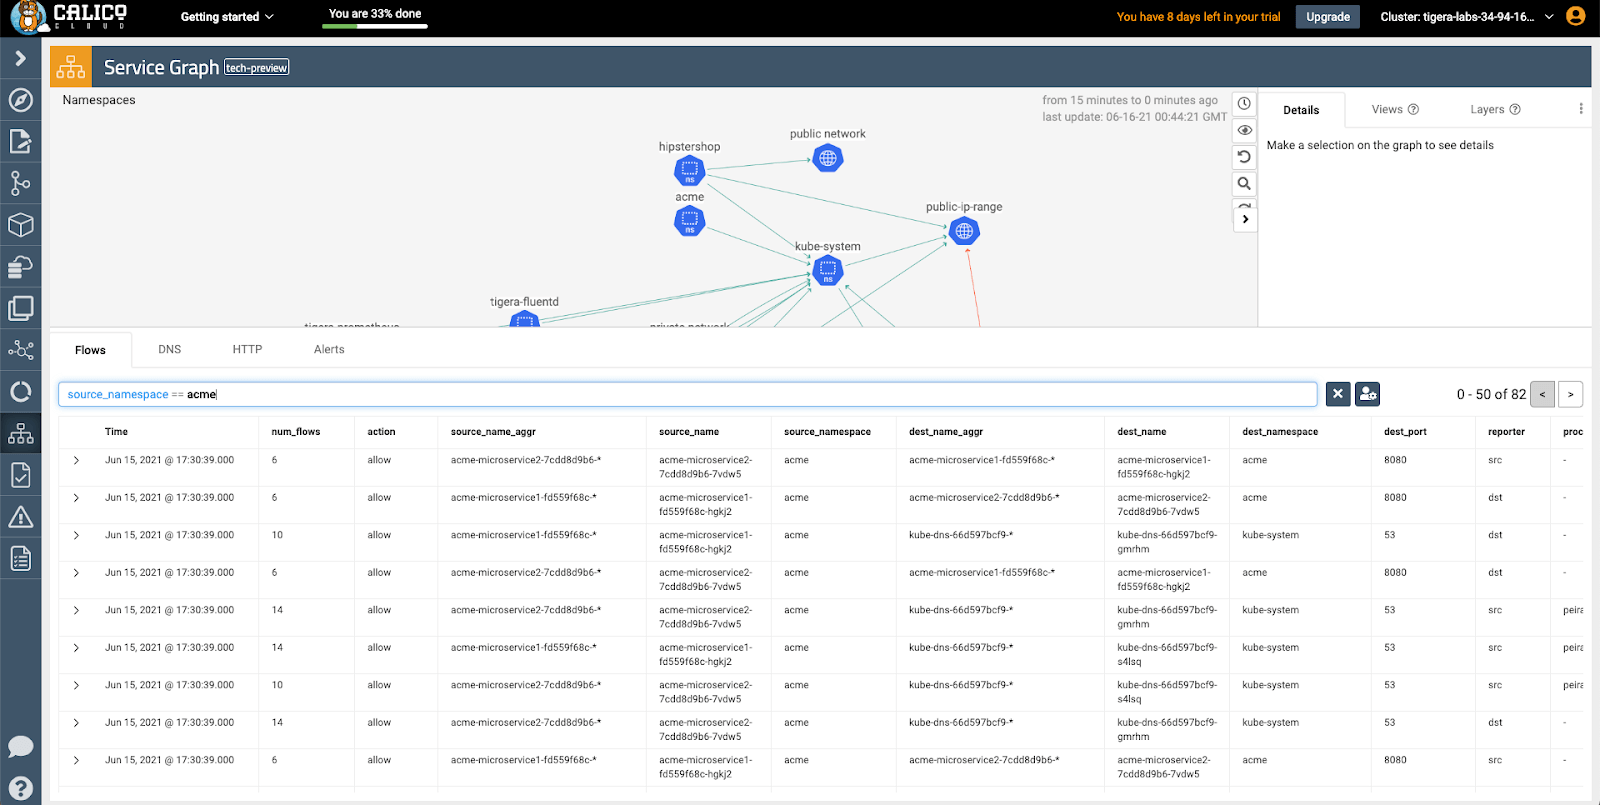
Calico Cloud provides Kubernetes-native observability with Dynamic Service Graph, which offers a visual representation of how different Kubernetes objects communicate with one another. Dynamic Service Graph provides a runtime visualization of microservices, namespaces, and pods interactions in the Kubernetes cluster. It auto-populates or depopulates according to how the components interact, always preserving the relationship context. As your environment grows larger, you can use built-in functions within the graph to focus on specific areas of interest.
In addition to these features, the graph allows you to:
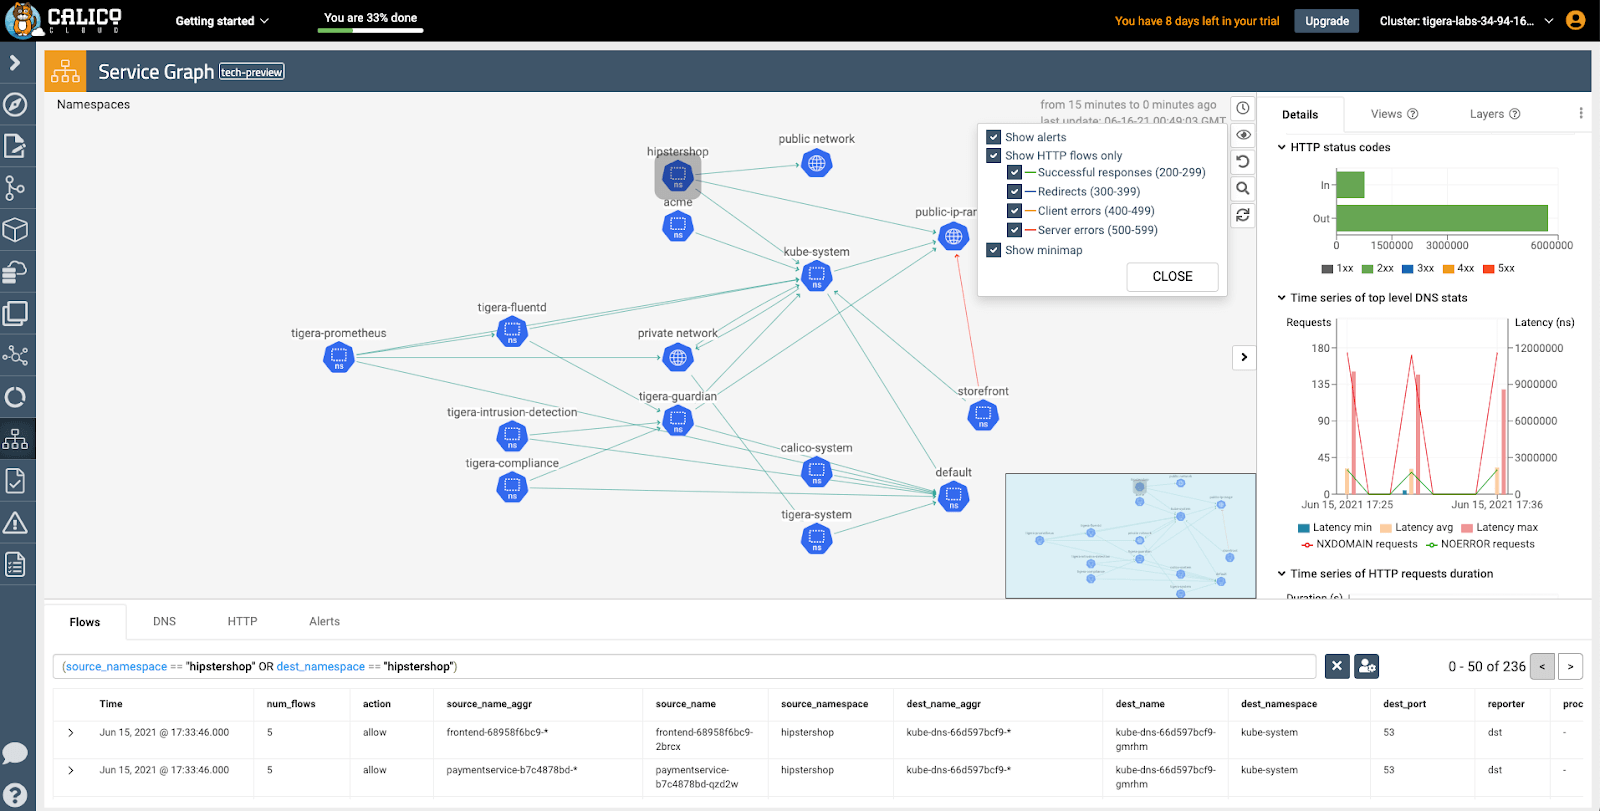
- Use layers, a feature of Dynamic Service Graph, to hide parts of the graph that are not relevant to your area of interest. Tigera provides pre-built layers for faster onboarding, and you can create your own views and share them with other team members. You can also select/deselect multiple layers in order to approach troubleshooting or root cause analysis from various points of view.
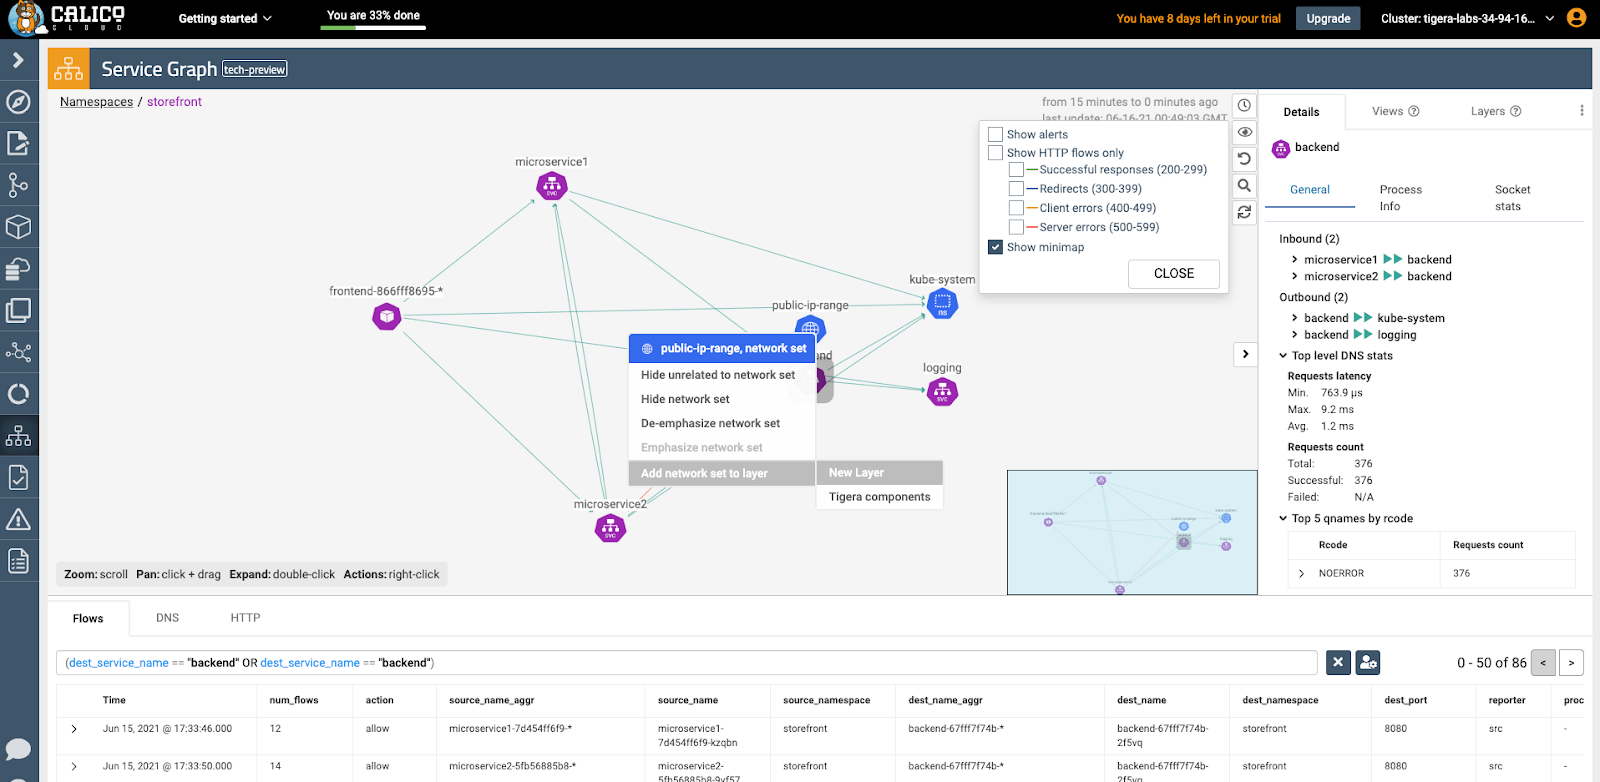
- Zoom in and use a mini-map feature to move around the graph, while maintaining a reference to where you are in your environment.
- Use filtering features in the graph by right-clicking the desired namespace or network sets and dynamically adding them to a layer to see its interaction with other components.
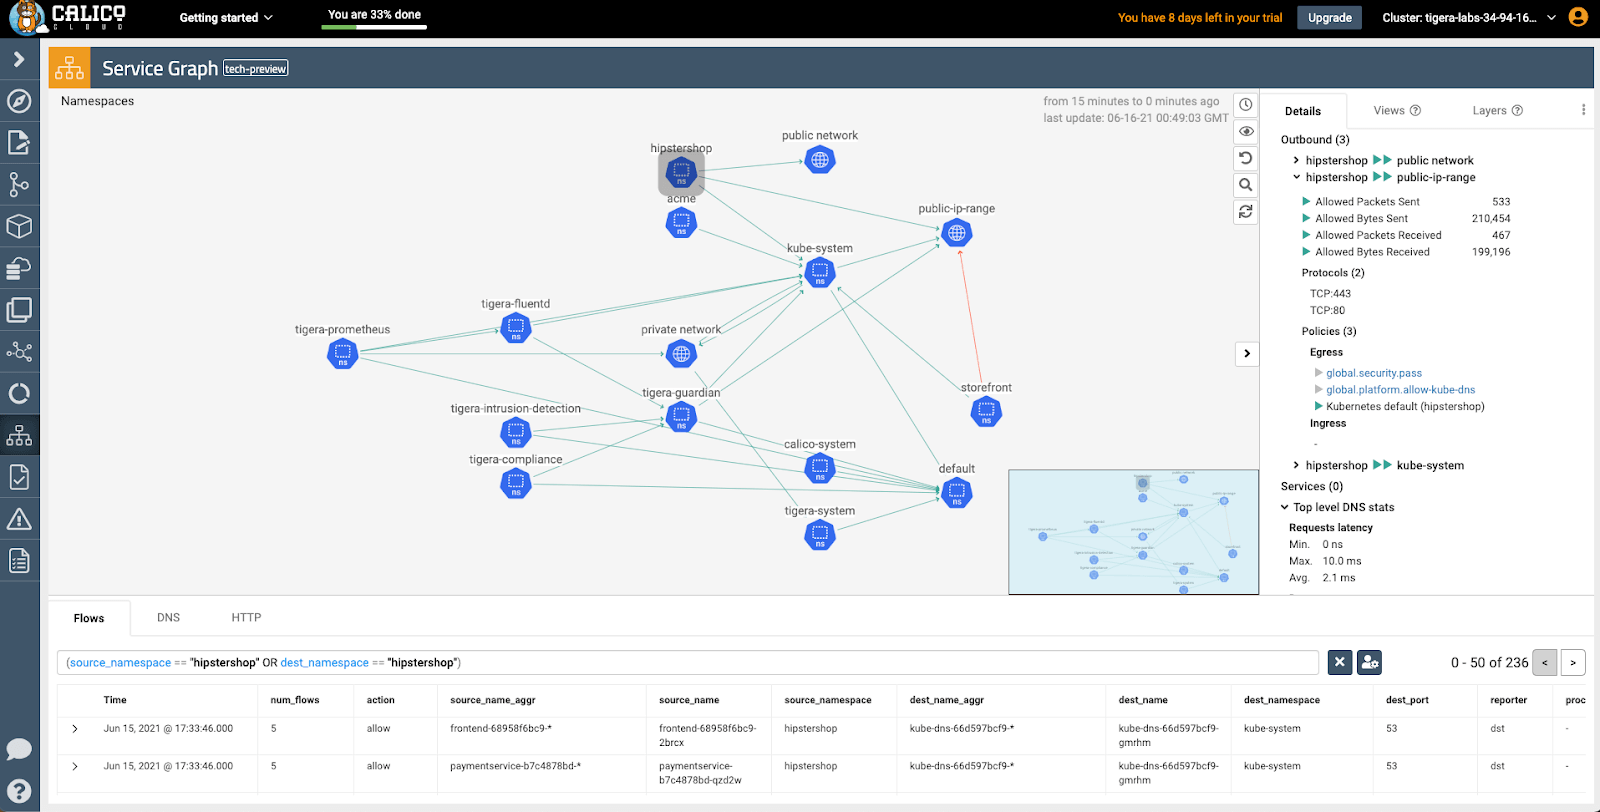
- Get live volumetric information per direction of each flow and the associated layer information about protocol and port.
- See security and network policies in action by hovering on the link in the graph as shown below. If you click on the policy, it will directly take you to the policy board where you can evaluate, modify, preview, and deploy the policy.
- Use the dynamic service graph’s query engine for quick search, to get specific data with respect to specific namespaces and corresponding activities.
- Get a summary of HTTP traffic directly on the details panel when selecting a node or edge on the graph. An additional tab provides you with direct access to L7 flows for troubleshooting scenarios where additional metadata may be required, thereby removing the need for complex service mesh implementation.
With Dynamic Service Graph, you can monitor communication between different components, analyze traffic flows, build and deploy network and security policies, and quickly identify service-level connectivity issues that impact your services and troubleshoot them in real time.
To learn more and experience Dynamic Service Graph for yourself, sign up for a free trial of Calico Cloud.
Join our mailing list
Get updates on blog posts, workshops, certification programs, new releases, and more!