A common challenge with multi-cluster connectivity is that networking solutions have a prerequisite of pod-to-pod connectivity enabled between the clusters that are to be meshed. This typically requires the user to take care of the underlying network infrastructure in terms of routing. One would need to make sure that both the K8s worker node networks (hereby referred to as the underlay network) as well as the pod network/pod CIDRs (hereby referred to as the overlay network) are routed between the clusters.
Typically, this requires intervention from multiple teams (like the network and platform teams) to configure a gateway or router and provide that overlay/underlay routing capability in an on-prem scenario.
In a public cloud scenario in AWS and EKS, one could use VPC CNI to get pod CIDR from the VPC CIDR and configure VPC peering to ensure routability of both underlay and overlay network, but this comes with its own major caveat: that IP exhaustion becomes a major issue as the number of pods scale and consume all the underlying VPC addresses.
Calico Cluster Mesh
The Calico cluster mesh can now be deployed in an overlay network mode (in addition to the previously available non-overlay mode) that leverages the Calico VXLAN overlay network. This means that all of the clusters that are being federated in the cluster mesh now will automatically take care of the overlay/pod network routing requirement when they join the mesh by leveraging the VXLAN tunnels setup by Calico CNI on both clusters. As a user, the only networking requirement that needs intervention is to make sure that the underlay network has been provisioned, and even in a public cloud scenario like Amazon EKS or Microsoft AKS, you use Calico as the cluster CNI to enable the cluster overlay and only use VPC IP addresses for the node networks while the pod networks can be configured as needed without restriction or involvement from the underlying network/platform and is completely platform-agnostic.
Quick Review
- Calico cluster mesh in overlay mode allows a user to not worry about routing the pod networks and takes advantage of VXLAN overlay to satisfy the routing requirement of pod-to-pod connectivity across the clusters to be federated.
- User reliance on network/infrastructure teams is reduced as they do not need to ask them to configure any routing/gateways to enable routing of the overlay pod networks.
- The cluster-mesh configuration is fully platform-agnostic as Calico is used as the CNI and the user is now empowered to use their own fully private and scalable pod IP pools, eliminating reliance on provider-specific infrastructure and networking limitations (like VPC CNI and IP exhaustion issues on AWS/EKS), opening up hybrid cloud and multi-region use-cases where underlay routing is the only requirement that user needs to take care of.
Remaining Prerequisites
The following prerequisites still remain true in cluster-mesh overlay mode:
- Pod CIDRs must be unique in each participating cluster because the cluster mesh is a routing solution and so cannot overlap. However, Calico allows the user full control over IPPools for the pod CIDR and the entire RFC1918 IP range (for IPv4).
- Underlay network of K8s worker node-to-node connectivity needs to be taken care of by the networking team, which may be different across platforms and introduce their own restrictions. As an example, using VPC peering in AWS to route the VPCs of different clusters/regions requires the VPC CIDRs to be non-overlapping as AWS does not provide the capability to use VRFs in VPC peering to potentially have the same VPC CIDRs peered. However, NAT gateways by virtue of the design allow for the same CIDR to be used in the VPC but at the cost of extra hops and increased latency.
Solution Overview
The high-level steps to facilitate a Calico cluster mesh with overlay mode enabled will be as follows:
- Two AWS regions to be used: ca-central-1 and us-east-1.
- An EKS cluster deployed into each VPC with unique VPC CIDRs (using the command-line tool
eksctland accompanying configuration YAML files) with only the control plane deployed first without any nodegroups for the worker nodes. - Nodegroups for the worker nodes/data plane with Calico OSS CNI deployed separately as per the official Calico docs to deploy EKS Clusters with Calico CNI, ensuring that the Calico pod IP pools are using unique pod CIDRs and VXLAN encapsulation in the Calico
InstallationCustomResource spec/manifest for each cluster. - Connect both EKS clusters to a Calico Cloud instance to enable the cluster-mesh feature as well as observability and Multi-cluster Management (MCM).
- Identify the created VPCs that the EKS clusters are deployed into and setup peering between them (using the AWS CLI).
- Set up the VXLAN cluster-mesh configurations and apply them using a provided script that automates the manual steps from the official Calico docs in the context of this setup.

Setup Walkthrough
Step 1: Clone the cluster-mesh setup repository and deploy the AWS resources
- Clone the repository:
git clone https://github.com/tigera-solutions/cent-mcm-overlay.git
- Ensure you follow the instructions in Module 1 and have all the needed prerequisites and CLI tools installed.
- Deploy the EKS clusters control-plane components, accompanying VPCs/subnets as per the instructions in Module 2.
Step 2: Install Calico OSS CNI, deploy EKS nodegroups and connect the clusters to Calico Cloud
- Install Calico CNI Installation CR manifest in each cluster and deploy the EKS nodegroups for the worker nodes as per instructions Module 3.2.
- Connect both clusters to Calico Cloud as follows:
Note: Docs link to the steps to connect a managed cluster to Calico Cloud.
Step 3: Set up VPC Peering to route underlay/node networks
- Follow the steps in Module 4 to identify the VPCs that both EKS clusters are deployed into, generate VPC peering requests, approve them and set up routes to each VPC’s peer in their respective routing tables.
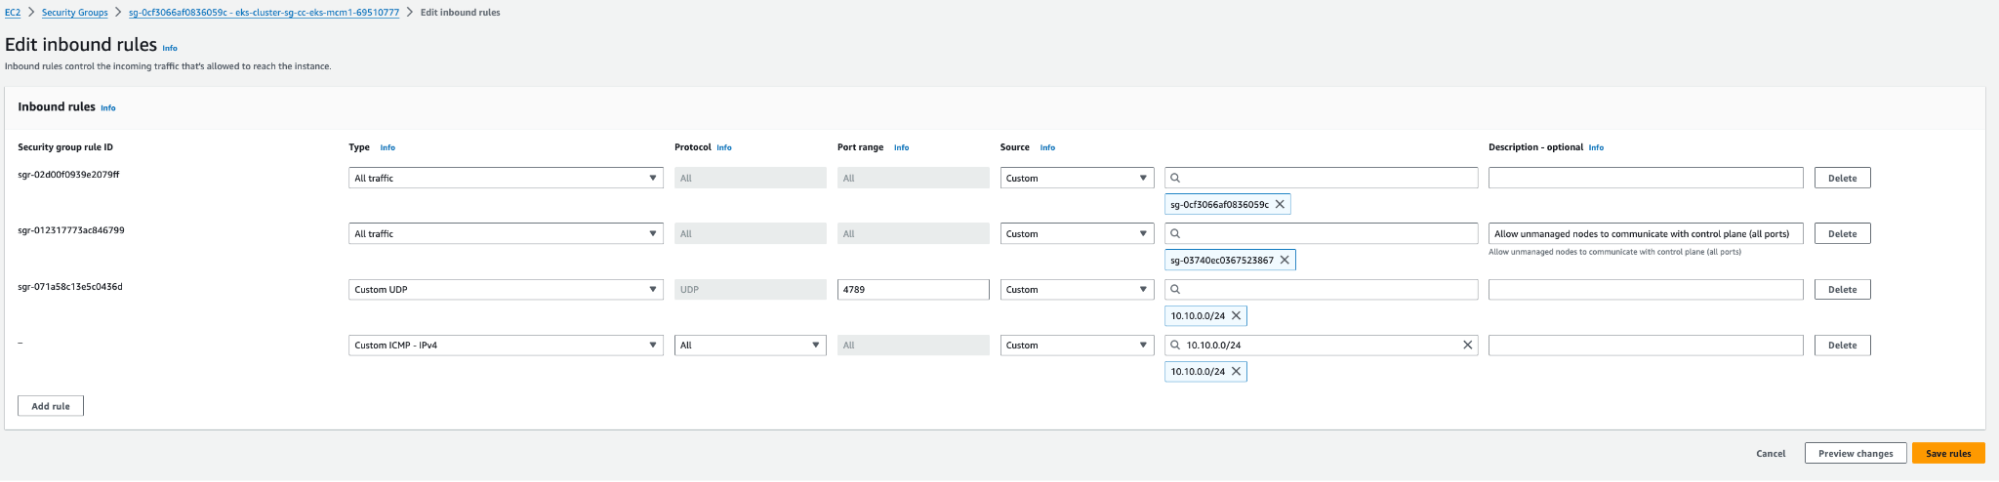
- Set up inbound security groups for the nodegroup in each VPC to allow the other’s CIDR for ICMP (for testing connectivity) and VXLAN UDP port 4789.
- Example:
- Cluster-1’s security group:

- Cluster-2’s security group:

- Cluster-1’s security group:
- Example:
- Validate the connectivity by pinging from one instance in a cluster to another instance in the neighboring cluster using the private IP address and ensure you get a response. This can be done by spinning up a debug pod in the host namespace of one of the nodes in one cluster and using that to ping the neighboring cluster node’s private IP.
- Steps to validate:
- Identify the nodes in cluster-1 in a terminal using
kubectl:kubectl get nodes NAME STATUS ROLES AGE VERSION ip-192-168-0-30.ca-central-1.compute.internal Ready <none> 88m v1.27.9-eks-5e0fdde ip-192-168-0-37.ca-central-1.compute.internal Ready <none> 88m v1.27.9-eks-5e0fdde ip-192-168-0-62.ca-central-1.compute.internal Ready <none> 88m v1.27.9-eks-5e0fdde
- Assign a variable to one of the node names:
NODE_NAME=ip-192-168-0-30.ca-central-1.compute.internal
- Spin up a debug pod on that node and exec into it, then
chrootinto the host namespace:kubectl debug node/$NODE_NAME -it --image=ubuntu
Creating debugging pod node-debugger-ip-192-168-0-30.ca-central-1.compute.internal-7mzbv with container debugger on node ip-192-168-0-30.ca-central-1.compute.internal.
If you don't see a command prompt, try pressing enter.
root@ip-192-168-0-30:/# chroot /host
sh-4.2#
- Ping one of the nodes in the other cluster using its internal IP and ensure you get a response:
sh-4.2# ip a | grep eth0
2: eth0: <BROADCAST,MULTICAST,UP,LOWER_UP> mtu 9001 qdisc mq state UP group default qlen 1000
   inet 192.168.0.30/27 brd 192.168.0.31 scope global dynamic eth0
sh-4.2# ping 10.10.0.20
PING 10.10.0.20 (10.10.0.20) 56(84) bytes of data.
64 bytes from 10.10.0.20: icmp_seq=1 ttl=255 time=14.8 ms
64 bytes from 10.10.0.20: icmp_seq=2 ttl=255 time=14.8 ms
64 bytes from 10.10.0.20: icmp_seq=3 ttl=255 time=14.8 ms
- Identify the nodes in cluster-1 in a terminal using
- Steps to validate:

Step 4: Set up overlay cluster mesh using the script in the Github Repository and test pod-to-pod connectivity across the cluster-mesh
Having ensured node-to-node underlay routability, setting up the cluster mesh requires the following steps for all participating clusters:
- Create the
ServiceAccountused by remote clusters for authentication. - Create the
ClusterRoleandClusterRoleBindingused by remote clusters for authorization. - Create the kubeconfig files needed to access each remote cluster.
- Create the
ServiceAccounttoken as aSecret. - Retrieve and save the certificate authority and server data in the kubeconfig file.
- Verify that the the kubeconfig file can be used to connect to the current cluster and access resources.
- Create the RemoteClusterConfigurations and accompanying RBAC resources (
RoleandRolebindings). - Validate the that the remote cluster connection can be established.
The above steps need to be completed on all participating clusters with the appropriate remote cluster configurations. Refer to Calico Cloud documentation as a reference if needed.
There is a script to automate those steps, create the configurations and apply them in the Github repository.
To create the cluster mesh between the two test clusters, follow the instructions in Module 5 of the Github repository.
Step 5: Deploy some demo microservice applications in both clusters
- Deploy app manifests across the two clusters.
- On Cluster-1:
kubectl create -f demo-apps/01-namespaces.yaml
kubectl create -f demo-apps/10-stars.yaml
kubectl create -f demo-apps/40-nginx-deploy.yaml
- On Cluster-2:
kubectl create -f demo-apps/02-namespaces.yaml
kubectl create -f demo-apps/20-hipstershop-app.yaml
kubectl create -f demo-apps/30-dev-app.yaml
kubectl create -f demo-apps/40-nginx-deploy.yaml
- On Cluster-1:
- The application workload pods are grouped in ‘zones’ by pod labels across the two clusters like so:


The demo environment implements a zone-based architecture across the clusters with three major applications – stars,dev-nginx and hipstershop:
On Cluster-1:
In cluster-1, we have the stars app pods labeled with zone=app1.
Run the following command to see this:
kubectl get pod -A -l zone=app1 -o custom-columns="POD-NAME:.metadata.name,NAMESPACE:.metadata.namespace,IP:.status.podIP,POD-LABELS:.metadata.labels"
POD-NAME                         NAMESPACE       IP               POD-LABELS
client-d668c86bf-sdc55           client          172.16.82.20     map[pod-template-hash:d668c86bf role:client zone:app1]
management-ui-6795d4f59c-h2ncq   management-ui   172.16.163.158   map[pod-template-hash:6795d4f59c role:management-ui zone:app1]
backend-8678866bb7-rxq6m         stars           172.16.163.156   map[pod-template-hash:8678866bb7 role:backend zone:app1]
frontend-595f6d847-ss9v7         stars           172.16.163.157   map[pod-template-hash:595f6d847 role:frontend zone:app1]
On Cluster-2:
In cluster-2, we have the dev pods labeled as zone=shared and the hipstershop app pods labeled as zone=app2.
Run the following command to see all the pods labeled as zone=shared:
kubectl get pod -A -l zone=shared -o custom-columns="POD-NAME:.metadata.name,NAMESPACE:.metadata.namespace,IP:.status.podIP,POD-LABELS:.metadata.labels"
POD-NAME
NAMESPACE   IP               POD-LABELS
centos                       default     172.17.226.144   map[app:centos zone:shared]
centos                       dev         172.17.64.19     map[app:centos zone:shared]
dev-nginx-8564bf5476-2xpff   dev         172.17.64.20     map[app:nginx pod-template-hash:8564bf5476 security:strict zone:shared]
dev-nginx-8564bf5476-kgbbp   dev         172.17.226.143   map[app:nginx pod-template-hash:8564bf5476 security:strict zone:shared]
netshoot                     dev         172.17.64.21     map[app:netshoot zone:shared]
Run the following command to see all the hipstershop app pods labeled as zone=app2:
kubectl get pod -A -l zone=app2 -o custom-columns="POD-NAME:.metadata.name,NAMESPACE:.metadata.namespace,IP:.status.podIP,POD-LABELS:.metadata.labels"
POD-NAME                                 NAMESPACE               IP               POD-LABELS
adservice-76488669b-jvtb7                adservice               172.17.226.142   map[app:adservice pod-template-hash:76488669b zone:app2]
cartservice-86648449bb-fzr9h             cartservice             172.17.64.16     map[app:cartservice pod-template-hash:86648449bb zone:app2]
checkoutservice-c9759c6cf-x9vxb          checkoutservice         172.17.64.11     map[app:checkoutservice pod-template-hash:c9759c6cf zone:app2]
currencyservice-84b75b6b94-fn8mj         currencyservice         172.17.64.17     map[app:currencyservice pod-template-hash:84b75b6b94 zone:app2]
emailservice-8666d6bbb6-dbbx6            emailservice            172.17.64.10     map[app:emailservice pod-template-hash:8666d6bbb6 zone:app2]
frontend-6c6f577957-lzk9w                frontend                172.17.64.13     map[app:frontend pod-template-hash:6c6f577957 zone:app2]
loadgenerator-8cdf78b5d-nd8h8            loadgenerator           172.17.64.23     map[app:loadgenerator pod-template-hash:8cdf78b5d zone:app2]
paymentservice-5f8d6b68cd-bwz2b          paymentservice          172.17.64.14     map[app:paymentservice pod-template-hash:5f8d6b68cd zone:app2]
productcatalogservice-58f5c6c474-b24dq   productcatalogservice   172.17.64.15     map[app:productcatalogservice pod-template-hash:58f5c6c474 zone:app2]
recommendationservice-66df778ccc-7q59p   recommendationservice   172.17.64.12     map[app:recommendationservice pod-template-hash:66df778ccc zone:app2]
redis-cart-7844cf686f-zs7vl              redis-cart              172.17.226.141   map[app:redis-cart pod-template-hash:7844cf686f zone:app2]
shippingservice-8957d5b7b-wxsfg          shippingservice         172.17.64.18     map[app:shippingservice pod-template-hash:8957d5b7b zone:app2]
Step 6: Validate cross-cluster pod-to-pod communication
Here we will run some traffic flow tests by doing kubectl exec into pods:
- Test traffic from the
clientpod inclientnamespace on cluster-1 to thefrontendpod in cluster-2.- First, determine the IP of the
frontendendpoint in cluster-2 by running the following command on cluster-2:kubectl get endpoints -n frontend frontend
This should give an output similar to:
NAME       ENDPOINTS           AGE
frontend   172.17.64.13:8080   47h
⚠️ The endpoint IP will be different in your cluster; the above output is just an example.
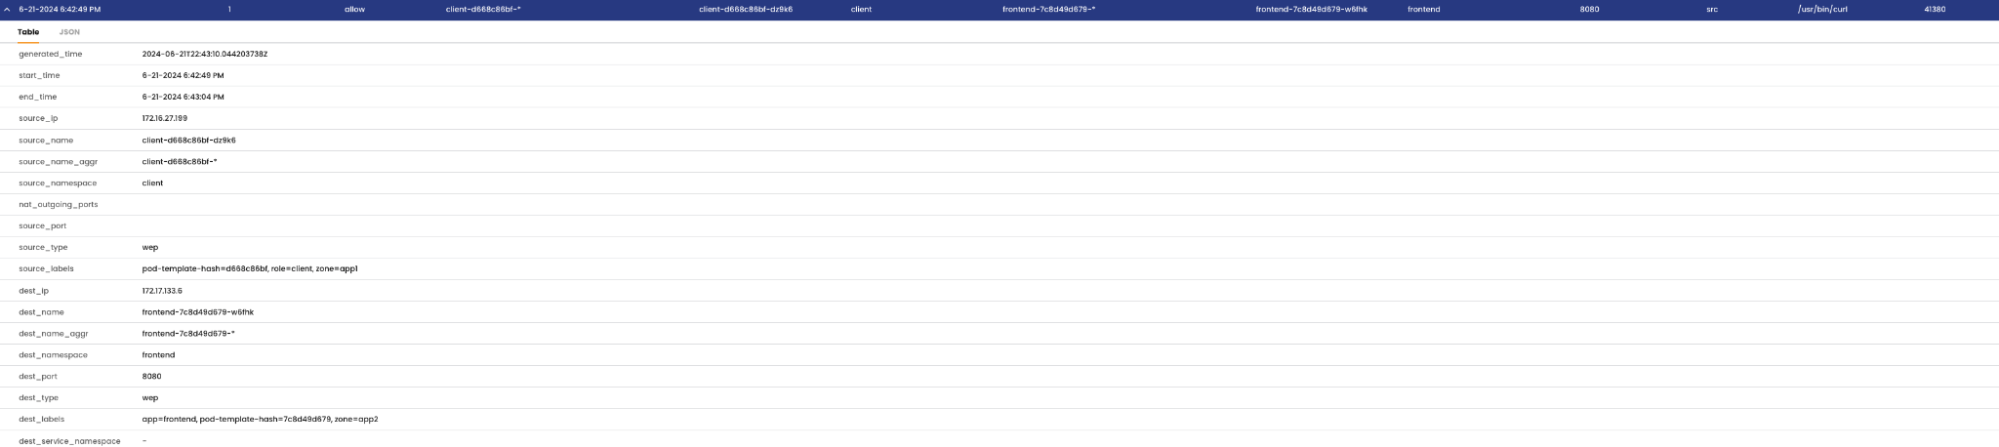
- Next, execute the curl command on the
clientpod inclientnamespace on cluster-1:kubectl -n client exec -it $(kubectl get po -n client -l role=client -ojsonpath='{.items[0].metadata.name}') -- /bin/bash -c 'curl -m3 -I http://<frontend-endpoint-ip>:<port>'⚠️ Substitute the <frontend-endpoint-ip>:<port> with the value from your cluster from the previous command.
You should get a successful response from the
frontendpod in cluster-2 like so:HTTP/1.1 200 OK Set-Cookie: shop_session-id=38c6c7be-e731-4048-a070-c94fbc1253b4; Max-Age=172800 Date: Thu, 30 Nov 2023 20:07:21 GMT Content-Type: text/html; charset=utf-8
The flow details are seen in the service graph from the cluster context of cluster-1:


- First, determine the IP of the
- Test traffic from the
clientpod inclientnamespace on cluster-1 to one of thenginxpods in thedevnamespace in cluster-2.- First, determine the IPs of the
nginx-svcendpoints in cluster-2 by running the following command on cluster-2:kubectl get endpoints -n dev nginx-svc
This should give an output similar to:
NAME        ENDPOINTS                           AGE
nginx-svc   172.17.226.143:80,172.17.64.20:80   2d
⚠️ The endpoint IP will be different in your cluster; the above output is just an example.
- Next, execute the curl command on the
clientpod inclientnamespace on cluster-1 to one of the nginx-svc endpoints:kubectl -n client exec -it $(kubectl get po -n client -l role=client -ojsonpath='{.items[0].metadata.name}') -- /bin/bash -c 'curl -m3 -I http://<nginx-svc-endpoint-ip>:<port>' - You should get a successful response from the
nginxpod like so:HTTP/1.1 200 OK Server: nginx/1.25.3 Date: Thu, 30 Nov 2023 20:43:34 GMT Content-Type: text/html Content-Length: 615 Last-Modified: Tue, 24 Oct 2023 13:46:47 GMT Connection: keep-alive ETag: "6537cac7-267" Accept-Ranges: bytes
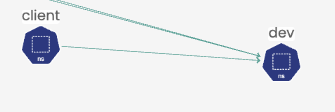
The flow details can also be seen in the service graph from the cluster context of cluster-2 reported as an incoming flow on the receiving
nginxpod:

- First, determine the IPs of the


Conclusion
In conclusion, augmenting the design of the original Calico cluster mesh to automatically allow the pod-to-pod connectivity across the clusters participating within the cluster mesh to connect over an overlay VXLAN network is important for organizations looking to implement a lean multi-cluster connectivity solution with minimal latency and packet overhead without a service-mesh or L7 connectivity model while still allowing the user to not have to worry about implementing external routers to exchange pod CIDR routes with the platform or infrastructure to facilitate connectivity across the mesh and reduce the reliance on platform-specific networking limitations. Calico makes it easy to configure and deploy the overlay cluster mesh and federate multi-cluster services and implement federated endpoint security effectively.
Ready to try Calico for yourself? Sign up for a free trial of Calico Cloud.