Network policies are essential for securing your Kubernetes clusters. They allow you to control which pods can communicate with each other, and to what extent. However, it can be difficult to keep track of all of your network policies and to ensure that they are configured correctly. This is especially true if you have a large and complex cluster with more than 100 nodes.
One way to address this challenge is to leverage Prometheus and AlertManager embedded in Calico Enterprise/Cloud. This will allow you to receive alerts when a specific network policy denies a packet. This will help you quickly identify and address any potential security issues or misconfigurations in your network policies.
In this blog post, I will show you how to configure this integration.
How to get easy notification when traffic gets denied in Kubernetes
Calico Enterprise and Calico Cloud offer robust network policy capabilities, including the ability to deny packets that fail to meet specific criteria. While this feature is powerful, it can be challenging to monitor all denied packets and take appropriate action, especially when implementing a new network policy.
You can configure Prometheus and AlertManager in Calico Enterprise/Cloud, allowing you to receive alerts when a specific network policy denies a packet. By leveraging this configuration, you can quickly identify and address any potential security vulnerabilities or misconfigurations in your network policies, ensuring the overall security and reliability of your Kubernetes environment.
Prometheus and AlertManager configuration
To configure Prometheus and AlertManager in Calico Enterprise/Cloud you will need to:
- Configuring AlertManager in Calico Cloud/Enterprise.
- Customizing alerts for specific network policies.
Once you have completed these steps, you will be able to receive alerts whenever a specific network policy denies a packet.
Configuring AlertManager on Calico Cloud/Enterprise
This section describes how to configure AlertManager on Calico Cloud/Enterprise.
- Let’s create the configuration file for AlertManager:
cat <<EOF >> alertmanager-config.yaml
global:
 resolve_timeout: 1m
route:
 receiver: 'tigera-alert'
 group_by: ['job']
 group_wait: 30s
 group_interval: 1m
 repeat_interval: 2m
receivers:
- name: 'tigera-alert'
 email_configs:
 - to: "<EMAIL>"
   from: "<EMAIL>"
   smarthost: "<SMTP_SERVER>:<PORT>"
   auth_username: "<EMAIL>"
   auth_identity: "<EMAIL>"
   auth_password: "<PASSWORD>"
   send_resolved: true
   headers:
     subject: 'Calico Alerts'
   tls_config:
     insecure_skip_verify: true
EOF
Where:
- repeat_interval: set how many minutes/hours you want to be notified about an existing alert if the alert persists.
- smarthost: specify your SMTP Server + port
Define the sender’s and receiver’s email addresses and also the password for the sender’s email address to authenticate to SMTP Server,
For this example, we have allowed insecure TLS, but it can also be configured by specifying the CA certificate as per AlertManager documentation.
The other configurations can also be modified based on needs and desires.
2. Export the alertmanager-calico-node-alertmanager secret:
kubectl -n tigera-operator get secrets alertmanager-calico-node-alertmanager -o yaml > alertmanager-secret.yaml
3. Encode the alertmanager-config.yaml base 64 and save it in the variable ALERT_CONFIG:
ALERT_CONFIG=$(cat alertmanager-config.yaml | base64 -w 0)
4. Replace the alertmanager.yaml value for the ALERT_CONFIG value in the alertmanager-secret.yaml
sed -i "s/alertmanager.yaml:.*/alertmanager.yaml: ${ALERT_CONFIG}/g" alertmanager-secret.yaml
5. Apply the new alertmanager-calico-node-alertmanager secret with the alertmanager configuration to send emails:
kubectl -n tigera-operator apply -f alertmanager-secret.yaml
6. Restart the alertmanager-calico-node-alertmanager statefulset:
kubectl rollout restart statefulset -n tigera-prometheus alertmanager-calico-node-alertmanager
The configuration can be verified by exposing the service calico-node-alertmanager on port 9093 in the tigera-prometheus namespace. By accessing the web interface, you can verify the configuration on the Status tab as per the screenshot below:
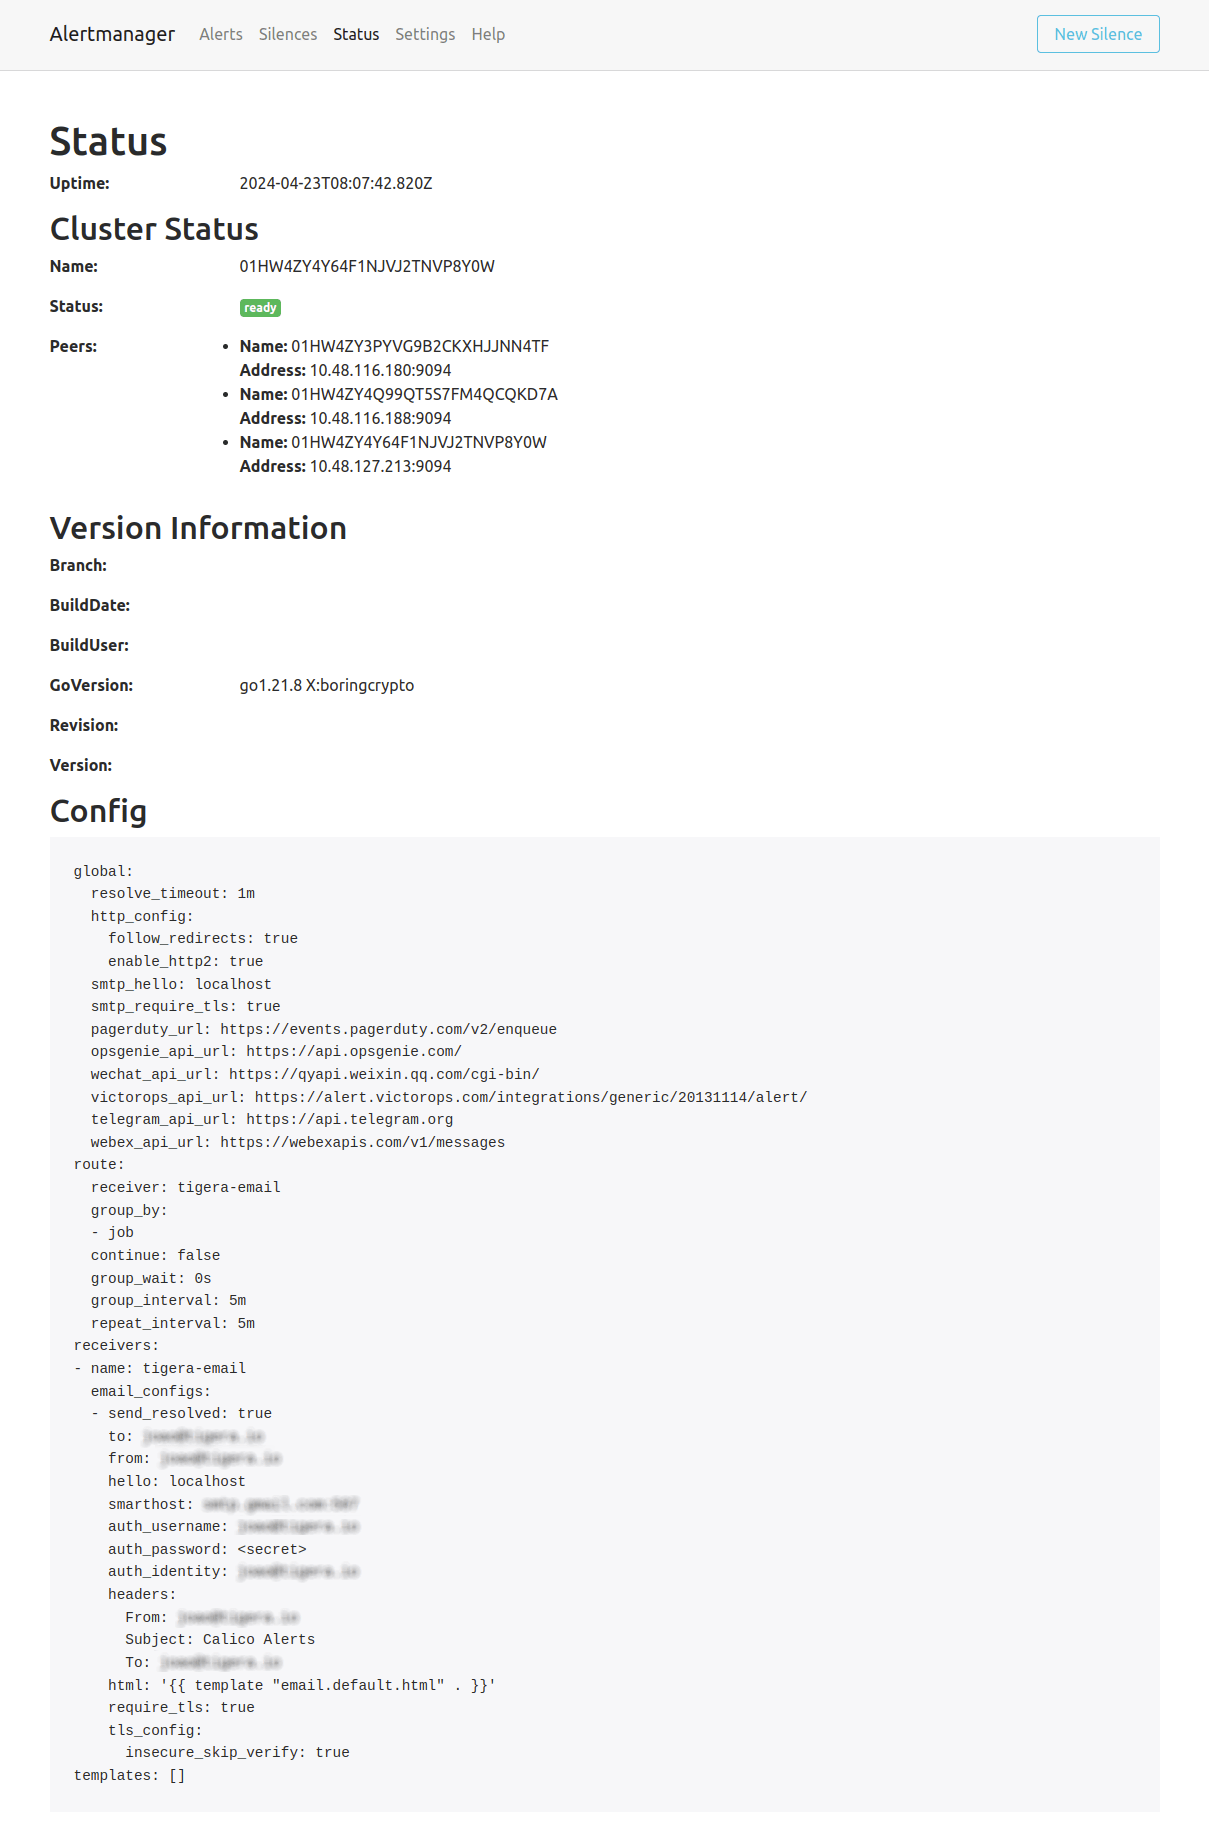
Exposing AlertManager web interface is not covered by this blog because it will depend on the cluster’s configuration.
Customizing alerts for specific network policies
Calico Enterprise/Cloud allows you to receive notifications tailored to your specific monitoring requirements. To achieve this, you can utilize Prometheus expression language expressions for filtering alerts, setting appropriate severity levels, and defining the layout of the alert.
- First, let’s create a network policy “test” to allow the egress DNS request and deny any ICMP for endpoints in the default namespace with the label “run = multitool”:
kubectl apply -f - <<EOF
apiVersion: projectcalico.org/v3
kind: NetworkPolicy
metadata:
  labels:
    projectcalico.org/tier: default
  name: default.test
  namespace: default
spec:
  egress:
  - action: Deny
    destination: {}
    protocol: ICMP
    source: {}
  - action: Allow
    destination:
      namespaceSelector: all()
      ports:
      - 53
      selector: k8s-app == "kube-dns"
    protocol: UDP
    source: {}
  order: -100
  selector: run == "multitool"
  tier: default
  types:
  - Egress
EOF
2. Create the Prometheus Rule that will trigger an alert from denied packets and any network policy that contains the string “test” as highlighted below.
kubectl apply -f - <<EOF
apiVersion: monitoring.coreos.com/v1
kind: PrometheusRule
metadata:
  labels:
    prometheus: calico-node-prometheus
    role: tigera-prometheus-rules
  name: tigera-prometheus-policy-deny
  namespace: tigera-prometheus
spec:
  groups:
  - name: calico.rules
    rules:
    - alert: PolicyDeny
      annotations:
        description: 'The policy {{$labels.policy}} denied packets from the IP {{$labels.srcIP}} on the calico-node pod
          {{$labels.pod}}'
        summary: Policy {{$labels.policy}} is denying packets
      expr: calico_denied_packets{policy=~".*test.*"} > 0
      labels:
        severity: warning
EOF
This Prometheus Rule will leverage the calico_denied_packets metric, and when there is any occurrence (> 0), the alert will be triggered. For this example, the severity is a warning but can be modified.
By customizing alerts for specific network policies, you gain greater control and visibility over your network security. This enables you to quickly identify and address potential threats, ensuring the reliability and integrity of your IT infrastructure.
Receiving email notifications for denied packets
To test the email notifications, you can trigger a network policy deny event and check if an email is received at the specified email addresses.
- Let’s create a
multitoolpod that will have configured the labelrun: multitoolautomatically, the label configured in the network policy previously:
kubectl run multitool --image=wbitt/network-multitool
2. Run a ping from the multitool pod to www.tigera.io and the network policy test will deny any ICMP packet:
kubectl exec multitool -- ping -c 1 www.tigera.io
3. The alert below will be sent to the receivers configured in the AlertManager configuration:
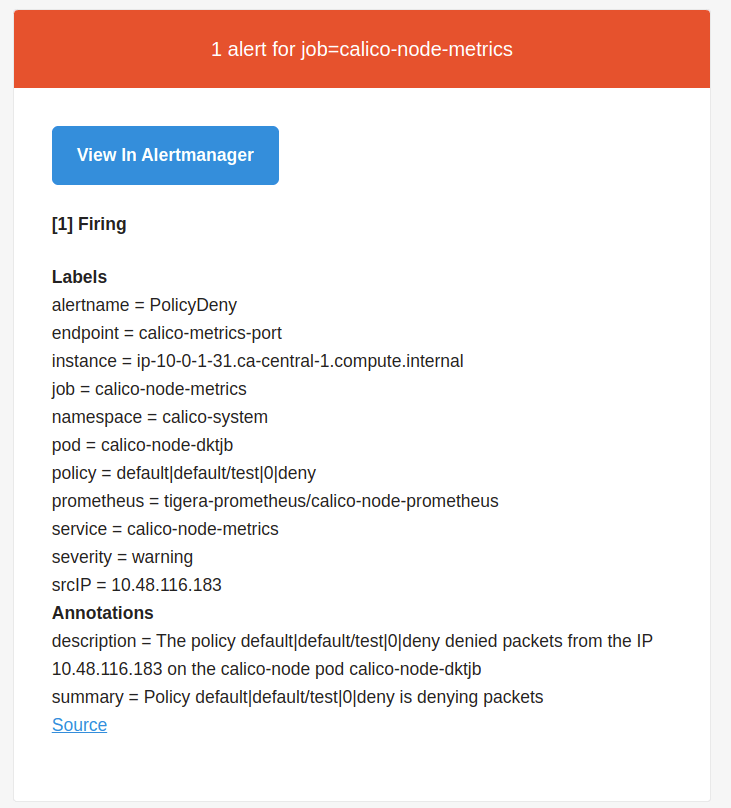
From this alert, we can highlight:
- alertname: name defined for the alert;
- instance: Kubernetes node where the pod is running;
- pod: calico-node pod that is running on the same Kubernetes nodes and enforced the network policy to deny the traffic;
- policy: the network policy that denied the traffic/packet;
- severity: the severity configured in the Prometheus Rul;
- srcIP: the IP of the pod that had the traffic denied. In this case, the “multitool” pod’s IP;
- description/summary: they are defined in the Prometheus Rules and can be customized.
In addition to email notifications, you can also implement additional monitoring and alerting mechanisms to complement email notifications. For example, you can also integrate AlertManager with other alerting systems such as PagerDuty or Opsgenie to receive alerts in different channels.
By implementing email notifications and additional monitoring, you can ensure that you are quickly notified of any potential security issues or misconfigurations in your network policies. This allows you to take prompt action to address the issues and maintain the security and integrity of your network.
Conclusion
Configuring Prometheus and AlertManager in Calico Enterprise/Cloud provides a powerful alert mechanism on network policy denials. By leveraging this integration, organizations can proactively identify and address potential security issues or misconfigurations in their network policies, enhancing their overall security posture.
Implementing such integration enables organizations can receive real-time alerts whenever a specific network policy denies a packet, and do a prompt investigation and remediation, thus minimizing the impact of potential security breaches or service disruptions. Moreover, customizing alerts for specific network policies empowers organizations to tailor their monitoring to their unique requirements, ensuring they receive the most relevant and actionable alerts.
Ready to try Calico network policies? Sign up for a free trial of Calico Cloud.
Join our mailing list
Get updates on blog posts, workshops, certification programs, new releases, and more!