In the ever-evolving landscape of Kubernetes networking and security, Calico has proven to be a battle-hardened, scalable and robust solution. Core to Calico’s architecture are two components, Felix and Typha. And given their importance for running Kubernetes deployment, it is no surprise that monitoring these components is crucial to secure and maintain them for optimal cluster operation.
This blog post explores the importance of Calico Typha and Felix metrics, providing insights into their roles, key metrics, and recommended monitoring practices.
Calico Architecture: Introducing Typha and Felix
Calico comprises various components, each playing a distinct role in ensuring the seamless functioning of Kubernetes environments. Among these, Typha and Felix take center stage, collectively responsible for Calico’s networking and security functions.
Typha: Scaling Datastore Proxy
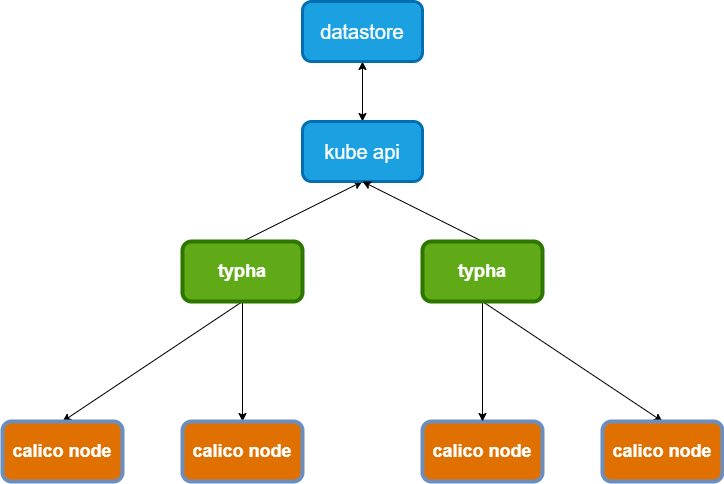
Typha acts as a caching datastore proxy, positioned between calico-nodes and the Kubernetes API server. Its primary function is to reduce the load on the Kubernetes API server, making it essential for large clusters. Typha watches for events related to nodes, pods, network policies, and BGP configurations on the Kubernetes API server. It then caches and deduplicates this data, efficiently distributing events to its many clients, with Felix being its primary recipient.
The significance of Typha lies in its ability to enhance cluster scalability by minimizing the memory requirements associated with continuous watches and requests from calico-nodes. Without Typha, managing large clusters could become resource-intensive and challenging.
Felix: Ensuring Policy Compliance
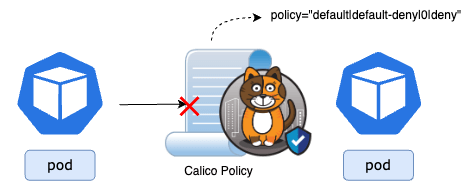
Felix, a core component of Calico-Node, plays a pivotal role in implementing Calico Network policies. Calico-Node metrics provide insights into BGP information and traffic flowing through Calico Network Policies.
For Felix to operate seamlessly, it must remain in continuous sync with the datastore, ensuring the correct application of policies to the respective nodes. It is also worth noting that, as an extra layer of security, these monitoring ports are protected by TLS (for Felix) or mTLS (for Calico-Node).
Monitoring Typha and Felix to secure Kubernetes application and optimize operations
Monitoring Calico-Node
Effective monitoring of Calico Enterprise involves paying attention to specific metrics that highlight the performance and health of key components. Calico-Node metrics can provide data on policy actions that can indicate misconfigurations or potential attacks.
Denied Traffic Metrics
These metrics represent the number of packets or bytes dropped by explicit or implicit deny rules. The goal is to have these metrics report zero under stable conditions so that any deviation could indicate policy and traffic divergence.
Metric
- calico_denied_packets
- calico_denied_bytes
Example Value
calico_denied_packets{
endpoint="calico-metrics-port",
instance="<node-FQDN>",
job="calico-node-metrics",
namespace="calico-system",
pod="calico-node-6pcqm",
policy="default|default-deny|0|deny",
service="calico-node-metrics",
srcIP="10.48.0.214"
}
Threshold Recommendations
Maintaining these metrics at zero is ideal, but achieving this depends on the cluster’s stability and policy maturity. It may be more achievable to determine a baseline metric and then monitor for deviations. These deviations can then indicate either:
- Unexpected traffic flowing through the cluster is being denied
- This may be a desired if you are only permitting traffic that you expect to see in the cluster
- Or there is a misconfigured policy that is denying traffic
- This is usually not desired and warrants using the metric output to investigation into the policy that is dropping traffic
Threshold Breach Symptoms
Unexpected traffic denial or dropped packets due to policy misconfigurations.
Threshold Breach Recommendations
Actions include investigating for potential attacks or allowing denied flows as needed, potentially updating policies accordingly.
Priority Level
Recommended
Monitoring Typha
Monitoring Typha involves tracking several metrics, each providing valuable insights into the component’s performance. Let’s explore key Typha metrics regarding it’s clients.
Client Connections Actively Streaming Metric
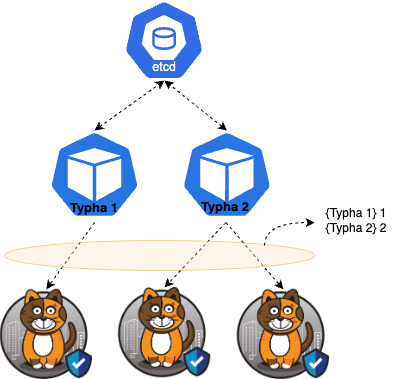
This metric signifies the current count of active connections in a “streaming” state, having completed the handshake, within Typha. It indicates the number of clients actively connected to a Typha instance.
Metric
- typha_connections_streaming
Example Value
{instance="10.0.1.20:9093"} 10
{instance="10.0.1.31:9093"} 5
Threshold Recommendations
It is recommended to compare the values of the Total Connections Accepted metric, and this Client Connections Actively Streaming metric. Their fluctuations should align, indicating the transition of Accepted Connections into Actively Streamed connections. Any discrepancy warrants investigation.
It is worth noting that, in smaller clusters, an imbalance in Typha connections may occur, which is acceptable as Typha can manage numerous connections efficiently.
Threshold Breach Symptoms
Issues may arise where Felix isn’t receiving updates from Typha, causing Calico Network Policies to fall out of sync.
Threshold Breach Recommendations
Examine Typha and Felix logs to determine potential issues that could cause an imbalance.
Priority Level
Recommended
Monitoring Felix Metrics
Felix is at the heart of Calico and can provide many valuable metrics. Here we will look at how fast Felix is applying dataplane updates.
Dataplane Apply Time Quantiles Metrics
- felix_int_dataplane_apply_time_seconds{quantile=”0.5”}
- felix_int_dataplane_apply_time_seconds{quantile=“0.9”}
- felix_int_dataplane_apply_time_seconds{quantile=“0.99″}
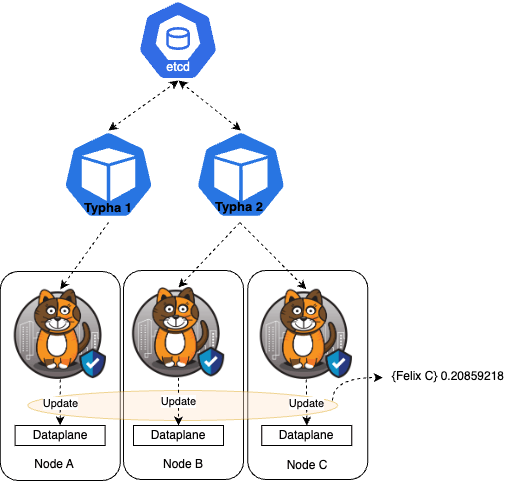
This metric denotes the time, in seconds, required to apply a dataplane update, viewed across the median (50th percentile), 90th percentile, and 99th percentile.
Example Value
felix_int_dataplane_apply_time_seconds{quantile="0.5"}:
felix_int_dataplane_apply_time_seconds{endpoint="metrics-port", instance="10.0.1.30:9091", job="felix-metrics-svc", namespace="calico-system", pod="calico-node-6pcqm", quantile="0.5", service="felix-metrics-svc"} 0.020859218
Threshold Recommendations
Threshold values will vary based on cluster size and update frequency. As always, it is recommended to establish a baseline to define a normal threshold value.
Examples of what has been seen in the field:
- 3-node test cluster averaging 100ms
- 1000-node 15x federated cluster averaging 30s (potentially larger at felix boot-time)
Threshold Breach Symptoms
Extended time-to-apply values can lead to delays between Calico Security Policy commits and their enforcement in the dataplane. This delay is influenced by Calico waiting for kube-proxy to release the iptables lock, which in turn depends on the number of services in use.
Threshold Breach Recommendations
Consider scaling cluster resources or reducing the number of Kubernetes services if feasible to mitigate prolonged dataplane update times.
Priority Level
Recommended
Conclusion
In conclusion, monitoring Calico Enterprise metrics, especially those related to Typha and Felix, is essential for maintaining a robust Kubernetes environment. Tigera’s recommended metrics provide a solid foundation for effective monitoring, ensuring that clusters operate at scale while upholding security and policy compliance. By understanding the significance of each metric and following the recommended monitoring practices, organizations can proactively address issues and enhance the overall performance of their Calico Enterprise deployments.
Ready to try Calico node-specific policies? Sign up for a free trial of Calico Cloud
Join our mailing list
Get updates on blog posts, workshops, certification programs, new releases, and more!