In my previous blog post, What you can’t do with Kubernetes network policies (unless you use Calico): Policies to all namespaces or pods, I talked about this use case from the list of nine things you cannot implement using basic Kubernetes network policy — policies to all namespaces or pods. In this blog post, we’ll be focusing on the next use case — advanced policy querying and reachability tooling.
Use case: Advanced policy querying and reachability tooling
If you’ve worked with Kubernetes network policies, you’ve likely encountered a challenge in ensuring that the policies you’ve set up are having the exact intended impact on the endpoints. In other words, it’s not straightforward to confirm whether your network policy is allowing or blocking traffic in the precise manner you intended. Even if you can access a command-line interface (CLI) within a pod and test connectivity to your desired destination, this test alone may not be sufficient. This is because there could be other network connections that are either blocked or permitted without your awareness. In essence, validating network policies can be more complex than it appears at first glance, as there might be hidden or unexpected network behaviors that your policies do not explicitly address.
Often, when we implement network policies, we realize that they don’t achieve the expected results. In the worst-case scenario, these policies can severely disrupt our application’s proper functioning. These challenges can be so problematic that they lead us to completely abandon the use of network policies.
One of the reasons behind this is the lack of capability to perform in-depth queries and analyses of network policies and their impact on network accessibility within a Kubernetes cluster. This includes the difficulty in determining which network traffic is allowed or denied by the network policies and comprehending the relationships between different pods and services in terms of network communication. As a result, many administrators and security teams hesitate to adopt security policies to effectively safeguard their clusters.
Here are some aspects of what this limitation from Kubernetes network policies mean:
- Complex Querying: Kubernetes network policies enable you to establish fundamental regulations for network traffic management. For instance, they allow you to permit or restrict traffic between pods based on specific labels. However, they may not offer advanced querying capabilities that enable you to express complex conditions involving multiple rules or perform detailed inquiries about the pods that are impacted by a particular network policy.
- Network Reachability Analysis: Analyzing network reachability requires advanced tools that can assess the potential network paths between pods, determine which policies apply to each path, and provide a comprehensive understanding of how they collectively influence communication. Although Kubernetes network policies offer basic control over ingress and egress traffic, they do not have built-in features to perform comprehensive network reachability analysis.
- Visualization and Monitoring: Advanced tooling usually includes visualization and monitoring capabilities to provide a more intuitive understanding of network policy impacts. Kubernetes itself does not provide sophisticated built-in tools for visualizing network policy interactions.
Calico offers robust observability features and capabilities that address these limitations, empowering you to closely monitor and gain valuable insights into your Kubernetes cluster. Here are some of the observability benefits that Calico can provide:
- Network Flow Logs: Generating network flow logs is a capability that Calico offers to capture detailed information about network traffic in your cluster. These logs contain critical information like source and destination IP addresses, ports, protocols, and traffic allowance or denial by network policies. This feature plays a vital role in auditing and troubleshooting network communication.
- Visibility into Network Policies: With Calico, you can monitor and gain insights into how your network policies impact network traffic even before they are applied. You can also review the policies that are being enforced on specific connections and verify if the traffic is being allowed or blocked as intended.
- Alerting: Calico provides a customizable alerting system that can notify you of network-related events or violations. You can easily set up alerts to inform you of specific events, such as network policy rule violations or unusual network activity.
- Integration with Monitoring and Logging Tools: Calico can integrate with popular observability and monitoring tools such as Prometheus, Grafana, and Elasticsearch. This allows network data to be collected and visualized together with other cluster performance metrics.
- Packet Tracing: Calico allows for network packet capture from a pod with a click of a button, enabling you to trace packets between pods. This can be immensely helpful in diagnosing network-related issues and eliminates the need to install and use packet capture tools on each pod.
- Performance Metrics: Calico can provide metrics for network traffic and policies, enabling analysis of their impact on applications and infrastructure.
- Troubleshooting: Calico’s observability features enable troubleshooting of network issues using network flow logs, packet captures, and other data to quickly resolve connectivity problems.
- Historical Data: Calico stores historical network data, useful for tracking traffic changes and investigating incidents.
Calico enhances Kubernetes network visibility, providing monitoring, troubleshooting, and security tools that ensure application reliability and security. Now, let’s explore some of Calico’s features in action.
Network Flow Logs
Calico flow logs continuously record every packet sent or received by the pods in your Kubernetes cluster. It is important to note that these logs do not contain all packet data, but instead only record the number of packets/bytes that were sent between specific IP addresses and ports, as well as when they were sent. To illustrate with an example, let’s use a very simple application where, in the namespace webserver, we have the WordPress application using two pods: One for the WordPress itself and another for the database.
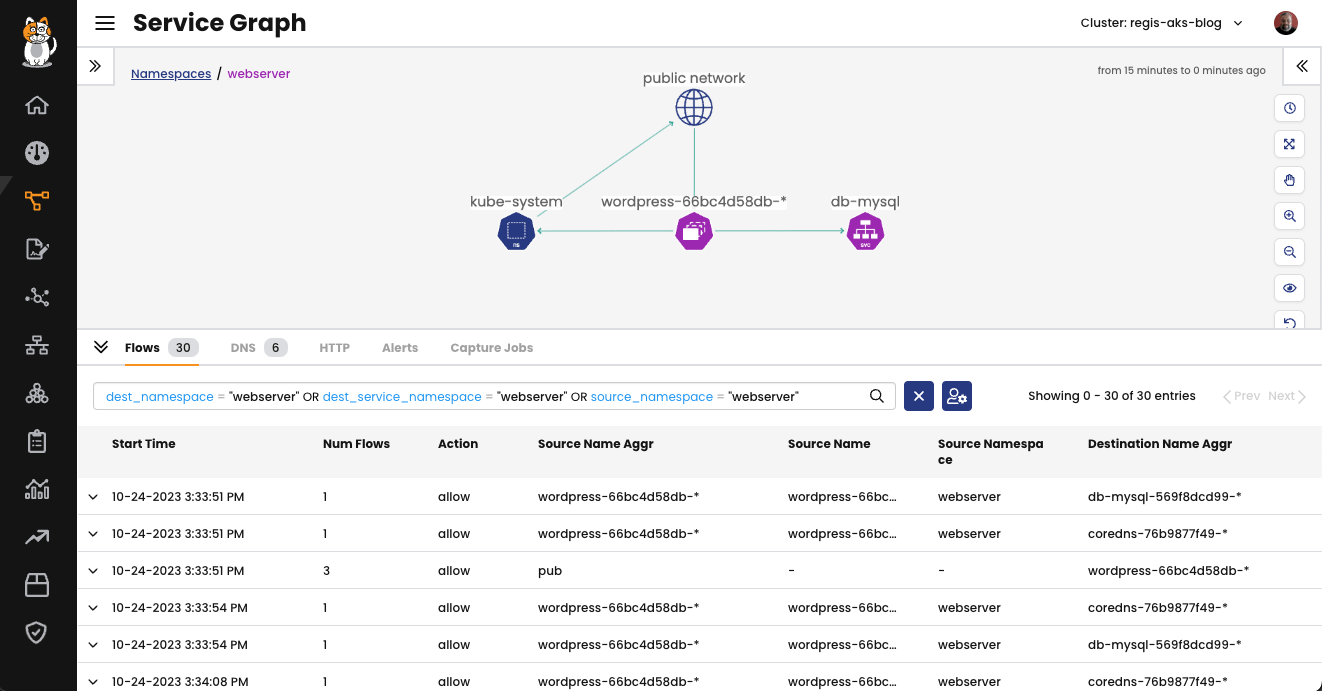
Fig 1: Sample application viewed in the Service Graph
The Service Graph provides a point-to-point, graph-based visualization of traffic flow and the corresponding security policies for workloads within the cluster, extending across different namespaces. Users can apply filters to focus on specific resources, allowing for a detailed analysis of both individual and collective interactions among workloads. Custom views can be saved, and pre-built views can be shared for collaboration.
Using the Service Graph you can observe the communication between both pods of the application and also the traffic coming from the internet (public network) while people access the website.
In the Flows, you can see a list of all network flows that were observed in this namespace. By default, Calico allows flow log aggregation for pod/workload endpoints. To reduce log volume, it uses an appropriate aggregation level, assuming that most users do not need to see the pod IP information. This is due to the ephemeral nature of pod IP address allocation. However, the level of aggregation depends on your specific deployment.
You have the option to choose a specific network flow and expand it to view all the additional details that Calico provides to enrich the information about that flow. See the image below for reference.
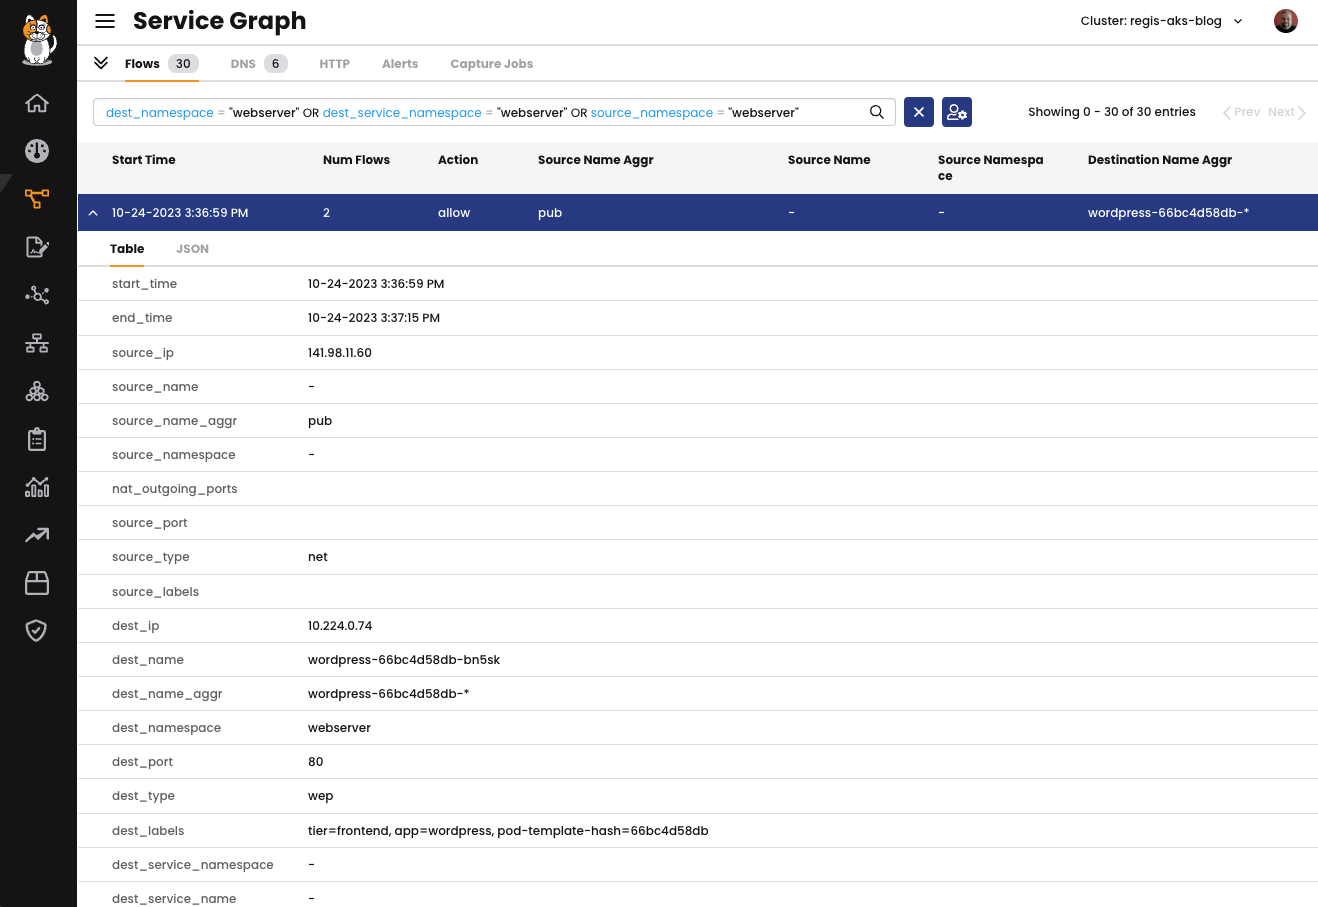
You can access various details regarding a specific flow, such as the source IP address, destination, destination labels, and other vital information. To explore all the available information, please check our documentation.
Visibility into Network Policies
Network policies serve as the fundamental means of securing your Kubernetes network. They are instrumental in controlling both incoming (ingress) and outgoing (egress) network traffic within your cluster, ensuring that only the desired traffic flows as intended. In Calico, these policies come in three forms:
- Calico network policy
- Calico Global network policy
- Kubernetes policy
Calico employs the concept of tiers, also known as hierarchical tiers, to establish a structured approach for managing network policies across different teams. These policy tiers allow users with higher authority, such as Security personnel, to enforce network policies that hold precedence over the policies defined by other teams, including service owners and developers.
By default, the Policies Board serves as the central hub for managing these tiered policies, providing an organized and accessible view of your network policy management.
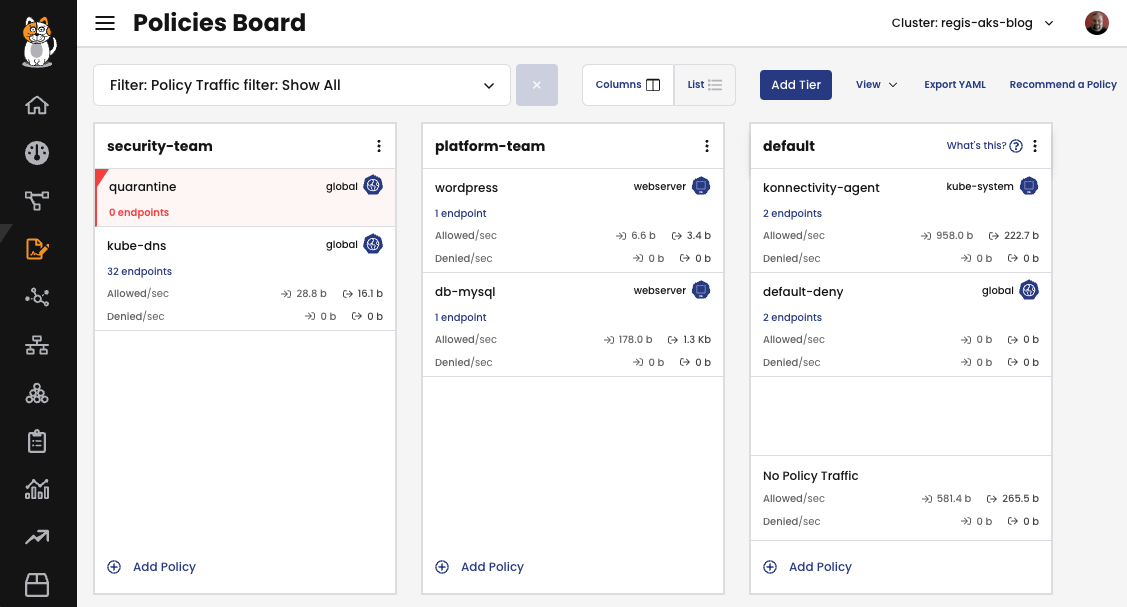
Users commonly employ a combination of YAML files and the Policies Board to create policies. Regardless of the method chosen, policies created via YAML files will be visible within the Policies Board. Similarly, policies crafted using the Policies Board can be cross-checked using the kubectl command or can even be exported in YAML format directly from the Policies Board.
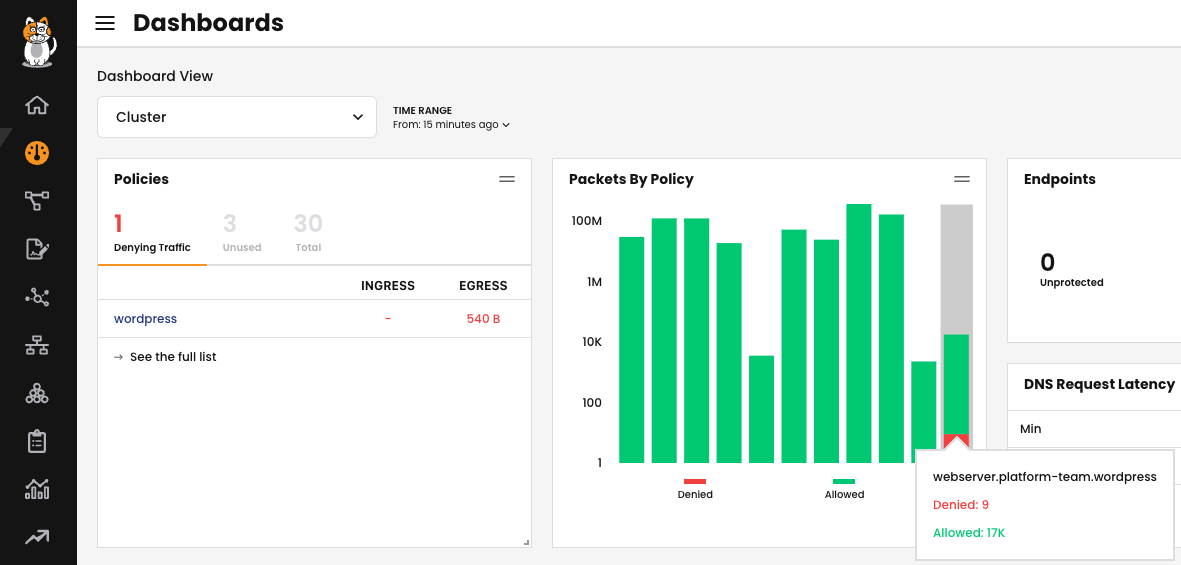
Within the dashboard, you have access to statistics and a list of policies that are actively denying traffic. This visibility significantly enhances your ability to troubleshoot and diagnose issues related to communication between pods. It helps ensure that critical traffic is not inadvertently blocked and allows for prompt resolution of any potential network conflicts.
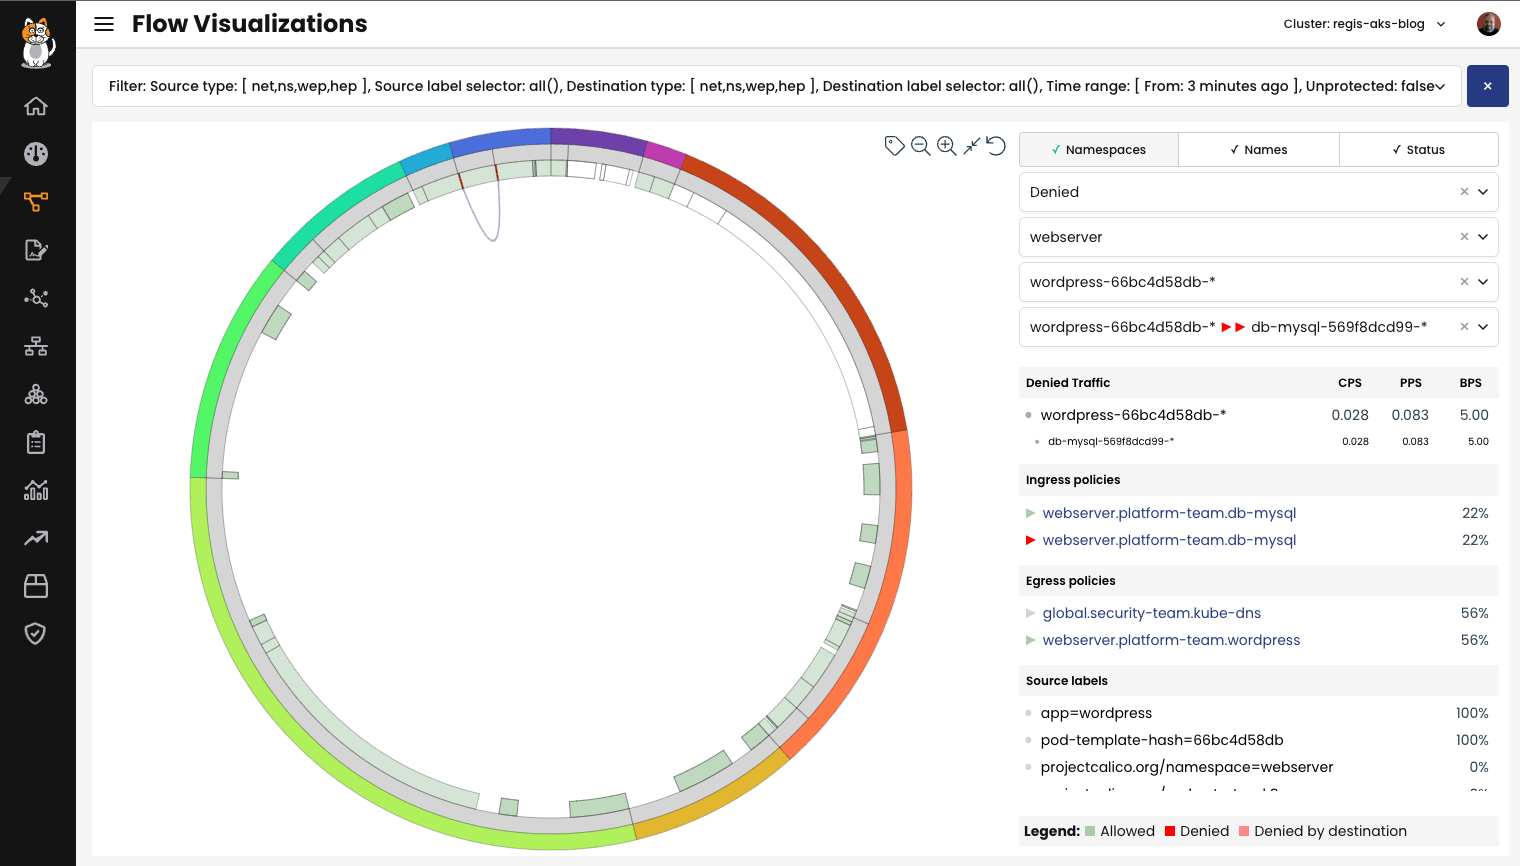
The Flow Visualizer is a useful tool in Calico designed to assist in troubleshooting blocked traffic. It provides an in-depth analysis of network traffic within the cluster, especially for troubleshooting purposes. The primary use case for the Flow Visualizer is to allow a detailed examination of network traffic and to determine which policies are permitting or blocking traffic between different services.
Alerting
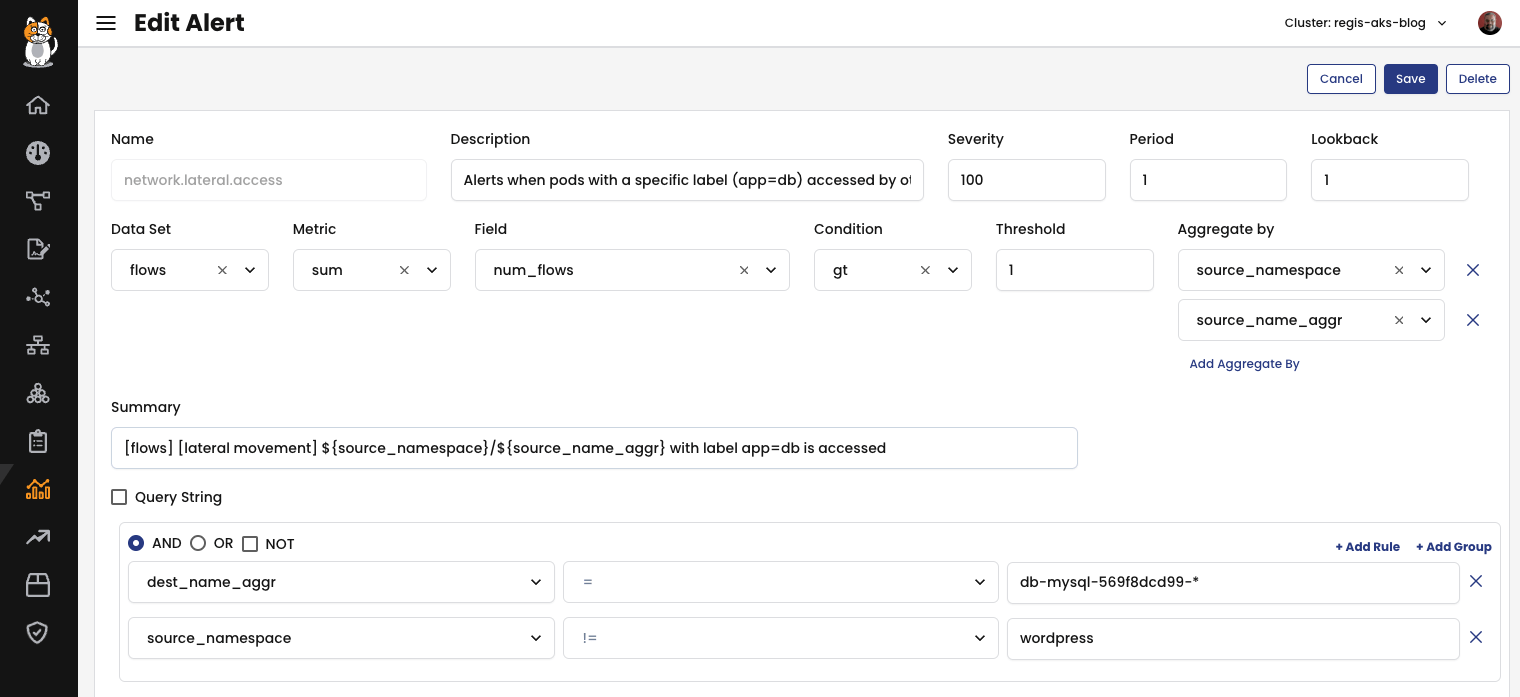
By utilizing the global alert resource in Calico, you can set up alerts to notify you when a network policy violation has occurred. A global alert resource essentially represents a query that is periodically executed against the datasets gathered by Calico Cloud. The results of these queries are then added to the “Alerts” page in the Calico Cloud Manager. These alerts can be configured to search for the presence of specific data rows in a query or to trigger when certain aggregated metrics meet specific conditions.
The following alert will generate a notification every time another workload other than WordPress tries to connect to the db-mysql database.
To test this alert, I created a pod named attacker in the namespace and initiated connection to the db-mysql workload. Here is the alert created in response to my connection attempt:
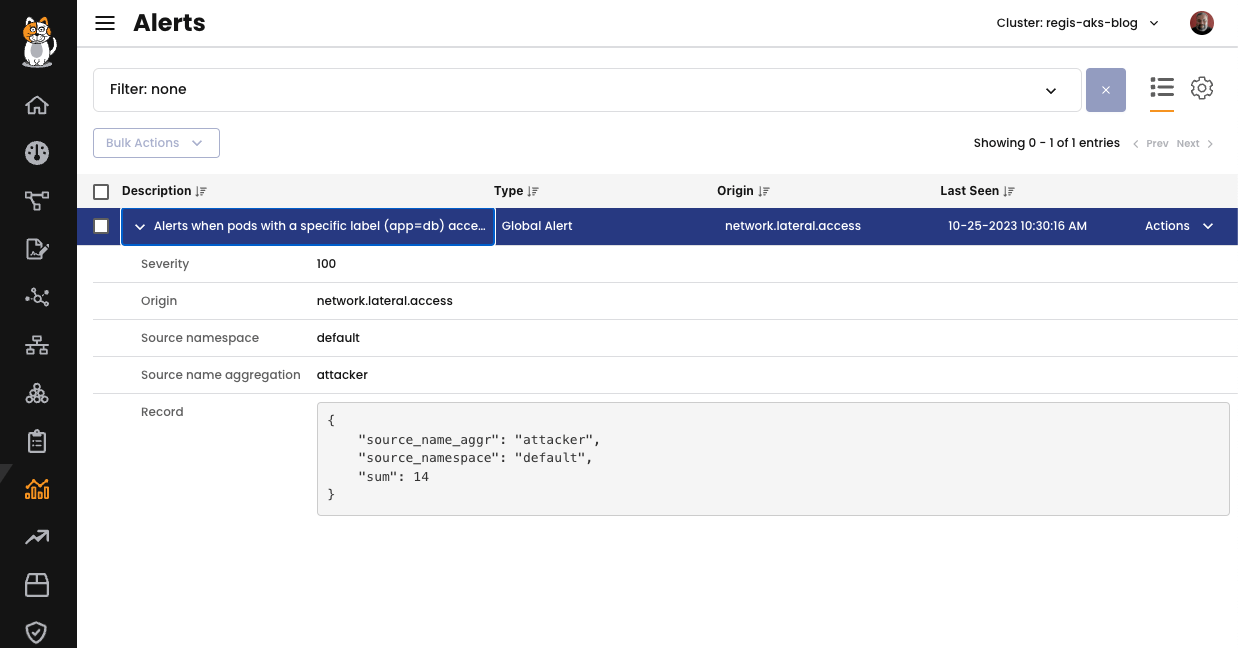
Alerts in Calico employ a specialized query language that allows you to specify the criteria for selecting records from the dataset to be used in the alert. This can be applied to identify flows with particular characteristics or to include or exclude specific namespaces from the alert considerations, etc. For more information, please refer to our documentation.
Packet Tracing with Packet Capture
Packet capture is often a go-to method for debugging communication between workloads in a distributed environment. However, it can be a challenging task in a dynamic environment where hundreds or even thousands of pods are created and destroyed regularly.
To tackle this problem, Calico Packet Capture offers a self-service, on-demand tool that enables users to perform packet capture for a specific pod or a collection of pods. This tool can save time and reduce frustration by facilitating easy and efficient debugging in dynamic environments where workloads are continuously evolving.
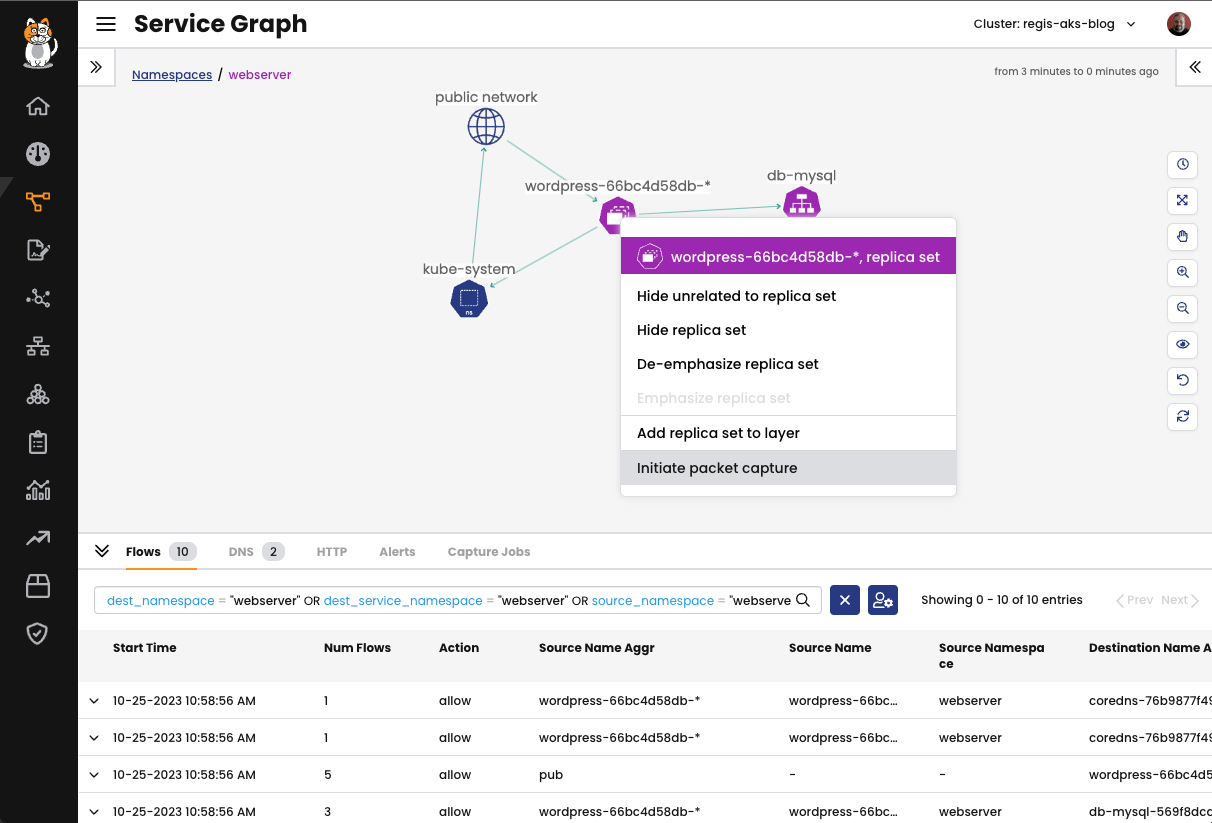
The integration of Packet Capture with Service Graph simplifies the process of capturing traffic for specific elements in your Kubernetes environment, such as a namespace, service, replica set, daemonset, statefulset, or pod. To initiate or schedule a capture, you can easily right-click on the desired endpoint. Afterward, you can download the capture files and visualize them in your preferred tool, such as WireShark. This streamlined approach facilitates efficient traffic analysis and troubleshooting within your Kubernetes cluster.
Calico Cloud’s packet capture feature provides the following capabilities:
- On-Demand Packet Capture: You can initiate packet captures at your convenience, 24/7, allowing you to investigate network traffic whenever the need arises.
- Scheduled Packet Captures: You have the option to pre-schedule packet captures to start and stop at specific times, making it easier to capture traffic during planned events or maintenance windows.
- Customized Packet Captures: Calico Cloud allows you to tailor packet captures by specifying specific ports and protocols, ensuring that you gather precisely the data you need for analysis.
- Collaborative Sharing: Packet capture jobs can be shared, enhancing collaboration within your team or with other stakeholders, making it easier to collectively investigate network issues.
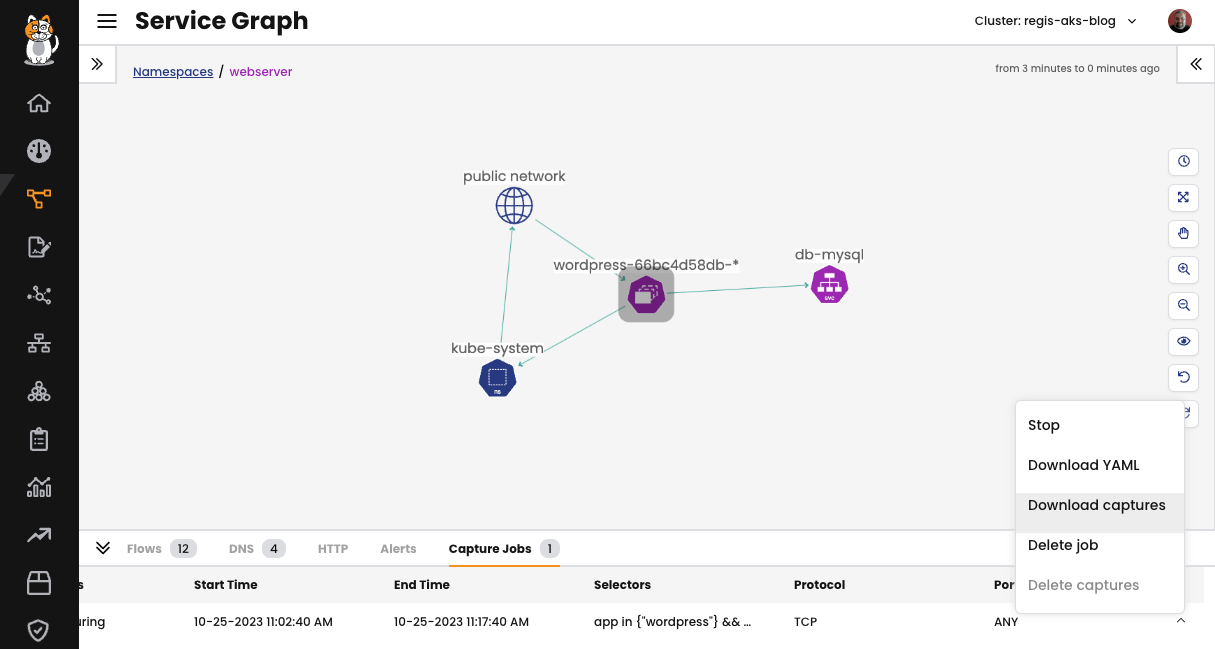
To illustrate, let’s create a packet capture from the WordPress application pod. Select the endpoint from the service graph, right-click, and select Initiate packet capture.
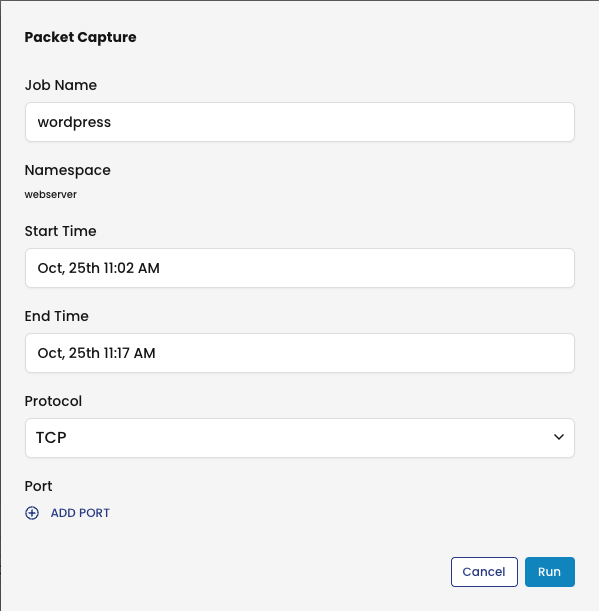
Schedule the capture to run now or at a later time, and click Run.
From the Capture Jobs tab in the bottom panel, the Status field will show that status, “Capturing”. Scroll to the right and click the drop-down menu for options to stop and manage captures. Click on Download captures, to save the packet capture in a pcap file format on your local computer.
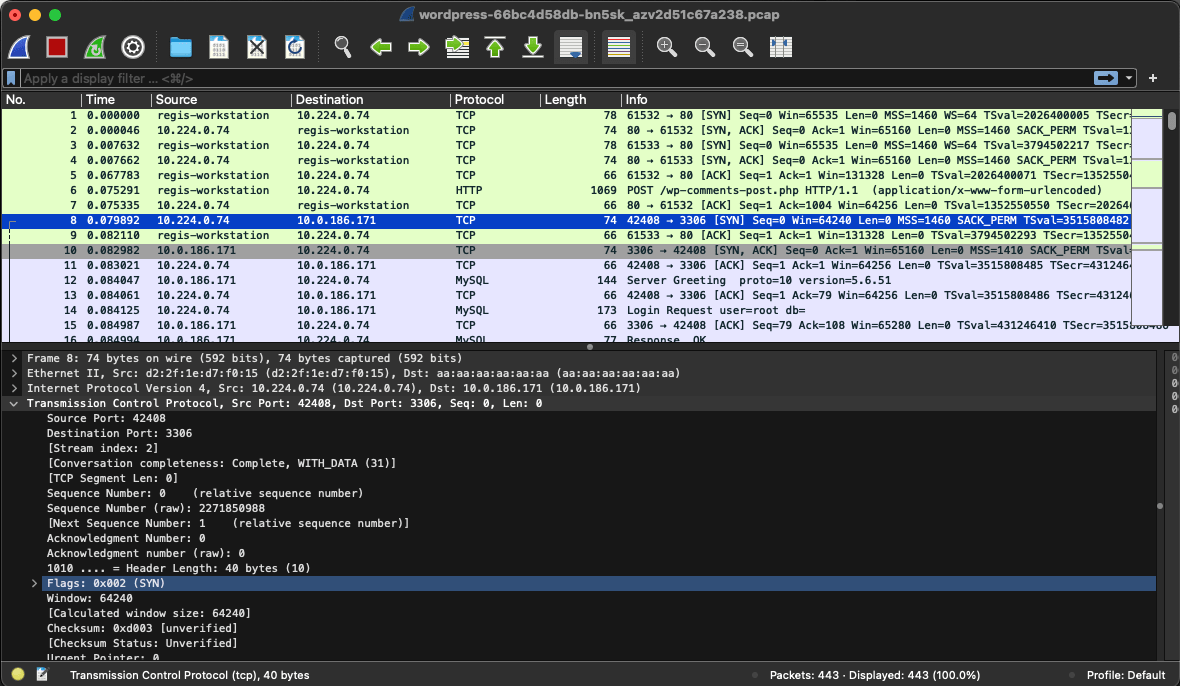
After downloading the capture, you can analyze it using the WireShark in your local workstation.
Benefits of using Calico for advanced policy querying
Essentially, Calico overcomes the limitations of Kubernetes network policies, offering a robust solution that enhances network visibility, security, and manageability, resulting in improved application reliability and network security with the following benefits to be highlighted:
Enhanced Policy Validation
Calico enables complex policy validation, allowing administrators to verify that network policies function as intended.
In-Depth Network Reachability Analysis
Calico offers tools for detailed network path analysis, ensuring a comprehensive understanding of how policies affect communication.
Visual Monitoring
Calico provides visualization tools for a clearer grasp of network policy interactions.
Network Flow Logs
Calico generates logs with essential network traffic information for auditing and troubleshooting.
Policy Visibility
Users can monitor the impact of network policies before they’re applied, ensuring policies are correctly enforced.
Custom Alerts
Calico’s alerting system can notify users of network events or policy violations, enabling proactive responses.
Integration with Monitoring Tools
Calico integrates seamlessly with popular monitoring tools for comprehensive data collection and visualization.
Packet Tracing
Calico’s packet capture simplifies debugging by enabling on-demand or scheduled captures and easy sharing for collaborative troubleshooting.
Performance Metrics
Calico provides performance metrics for network traffic and policies, aiding resource management.
Historical Data
Calico stores historical network data for tracking changes and incident investigation.
Conclusion
In this multi-part blog series, we are exploring some of the limitations of Kubernetes network policies and how you can overcome them by using Calico. In this post, we delved into a crucial use case: advanced policy querying and reachability tooling.
In the upcoming blog post, we will discuss the limitations of native Kubernetes network policies, specifically the ability to log network security events. We’ll showcase how Calico addresses this issue by meticulously monitoring and logging all network security events and providing the capability to create custom alerts when malicious behavior is detected. Stay tuned!
Ready to try Calico node-specific policies? Sign up for a free trial of Calico Cloud
Join our mailing list
Get updates on blog posts, workshops, certification programs, new releases, and more!