Metrics are important for a microservices application running on Kubernetes because they provide visibility into the health and performance of the application. This visibility can be used to troubleshoot problems, optimize the application, and ensure that it is meeting its SLAs.
Some of the challenges that metrics solve for microservices applications running on Kubernetes include:
- Visibility: Microservices applications are typically composed of many small, independent services. This can make it difficult to get a clear picture of the overall health and performance of the application. Metrics provide a way to aggregate data from all of the services, giving you a single view of the application.
- Troubleshooting: When something goes wrong with a microservices application, it can be difficult to identify the root cause of the problem. Metrics can help you to track down the problem by providing information about the state of the application at the time of the failure.
- Optimization: Metrics can be used to optimize the performance of a microservices application. By tracking metrics such as CPU usage, memory usage, and network traffic, you can identify areas where the application can be improved.
- SLAs: Many microservices applications have SLAs that they must meet. Metrics can be used to track the performance of the application against its SLAs, so that you can take action if the application is not meeting its targets.
Calico is the most adopted technology for Kubernetes networking and security. Calico collects and provides a variety of metrics to help improve visibility and security. These include:
- Network metrics: These metrics track the flow of traffic through the network, including the number of packets and bytes sent and received, the source and destination of the traffic, and the ports that are being used.
- Policy metrics: These metrics track the enforcement of Calico policies, including the number of policies that have been created, the number of policies that are in effect, and the number of violations that have been detected.
- Node metrics: These metrics track the health of the Calico nodes, including the CPU and memory usage, the number of open file descriptors, and the number of network interfaces.
Calico also collects layer 7 metrics, such as:
- HTTP requests: The number of HTTP requests that have been made, the source and destination of the requests, and the status codes of the responses.
- DNS queries: The number of DNS queries that have been made, the source and destination of the queries, and the domain names that were queried.
- TLS connections: The number of TLS connections that have been established, the source and destination of the connections, and the ciphers that were used.
One critical aspect when shifting to a microservices model is to make sure we at least maintain, or improve the level of monitoring and control, so we are able to react to potential scale issues or outages. As one of the more mature projects under the scope of the CNCF, Prometheus is probably the most common tool to carry out tasks of monitoring and alerting in your Kubernetes environment.
One typical requirement for DevOps and platform teams is to integrate existing Prometheus resources to gather Calico statistics, or alternatively, add the Calico Prometheus service as a data source in an analytics and visualization tool such as Grafana. We will explore both approaches in this blog.
BYO Prometheus
Calico Enterprise provides an out-of-the-box Prometheus deployment, which is used to populate our dashboards.
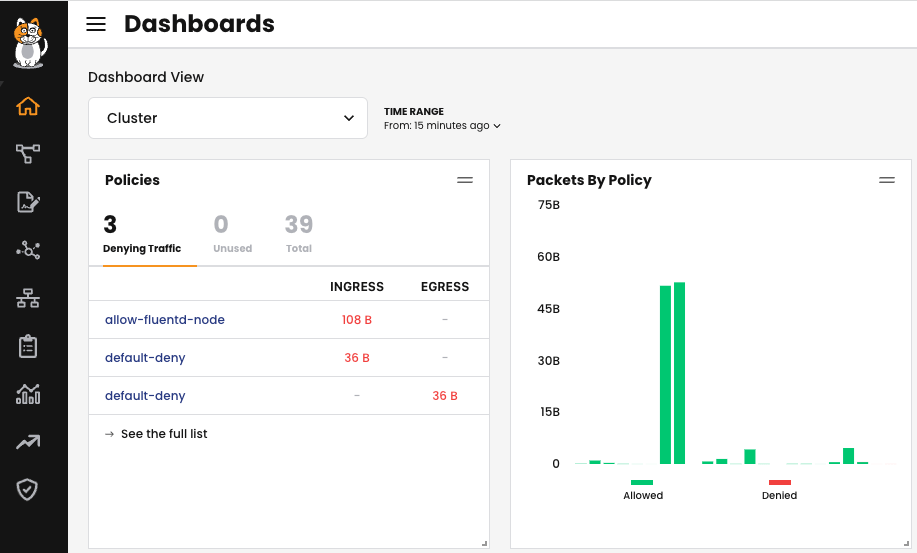
Fig 1: Calico dashboard homepage
However, in many cases, there is already a Prometheus deployment with a bigger monitoring scope, and Tigera Prometheus needs to be “stacked” into this already existing solution, so you have all metrics in a single place. As all communication across Calico metrics endpoints are secured, the existing Prometheus resource must be modified to be able to establish this TLS connectivity. The general steps to do that are as follows:
1. Copy the following secret and config map to the destination namespace of your main Prometheus deployment (“monitoring” in the examples below):
$ kubectl get secret -n tigera-prometheus | grep ^calico-node
calico-node-prometheus-tls      Opaque         2      12d
$ kubectl get cm -n tigera-prometheus tigera-ca-bundle
NAME               DATA   AGE
tigera-ca-bundle   2      12d
2. Get the service account for the main Prometheus resource that will monitor Calico stats:
$ kubectl get prometheus -n monitoring -oyaml | grep serviceAccountName
serviceAccountName: prometheus-stack-kube-prom-prometheus
For the role bound to that service account, include the following (make sure you backup your current ClusterRole, and Prometheus resource before doing any change to them):
apiVersion: rbac.authorization.k8s.io/v1
kind: ClusterRole
metadata:
<OMITTED>
  name: prometheus-stack-kube-prom-prometheus
  resourceVersion: "3226528"
  uid: 88accaf5-98bc-4956-870c-6178c016f99b
rules:
- apiGroups:
  - ""
  resources:
  - nodes
  - nodes/metrics
  - services
  - endpoints
  - pods
  verbs:
  - get
  - list
  - watch
- apiGroups:
  - networking.k8s.io
  resources:
- ingresses
  verbs:
  - get
  - list
  - watch
- nonResourceURLs:
  - /metrics
  - /metrics/cadvisor
  verbs:
  - get
- apiGroups:
  - authentication.k8s.io
  resources:
  - tokenreviews
  verbs:
  - create
- apiGroups:
  - authorization.k8s.io
  resources:
  - subjectaccessreviews
  verbs:
  - create
- apiGroups:
  - ""
  resources:
  - configmaps
  verbs:
  - get
3. In the main Prometheus resource, add the volumes needed for the TLS connectivity, and add the label to track the Service Monitor (team: network-operators). Likely there will be other labels there):
kubectl edit prometheus prometheus-stack-kube-prom-prometheus -n monitoring
<OMITTED>
 71   serviceAccountName: prometheus-stack-kube-prom-prometheus
 72   serviceMonitorNamespaceSelector: {}
 73   serviceMonitorSelector:
 74     matchLabels:
 75       team: network-operators
 76   shards: 1
 77   tsdb:
 78     outOfOrderTimeWindow: 0s
 79   version: v2.44.0
 80   volumeMounts:
 81   - mountPath: /etc/pki/tls/certs
 82     name: tigera-ca-bundle
 83     readOnly: true
 84   - mountPath: /calico-node-prometheus-tls
 85     name: calico-node-prometheus-tls
 86     readOnly: true
<OMITTED>
 90   volumes:
 91   - name: calico-node-prometheus-tls
 92     secret:
 93       defaultMode: 420
 94       secretName: calico-node-prometheus-tls
<OMITTED>
 99   - configMap:
100       name: tigera-ca-bundle
101     name: tigera-ca-bundle
<OMITTED>
You can test the certs are in the new pod when this is redeployed:
$ kubectl exec -it prometheus-prometheus-stack-kube-prom-prometheus-0 -n monitoring -- sh
/prometheus $ ls /*tls
/calico-node-prometheus-tls:
tls.crt  tls.ke

/prometheus $ ls /etc/pki/tls/certs/tigera-ca-bundle.crt
/etc/pki/tls/certs/tigera-ca-bundle.crt
/prometheus $
Please note we expose several metrics:
$ kubectl get servicemonitor -n tigera-prometheus
NAME                              AGE
calico-kube-controllers-monitor   6d19h
calico-node-monitor               12d
elasticsearch-metrics             12d
fluentd-metrics                   12d
tigera-api                        12d
4. For any of those, create the proper service monitor as described in the documentation below:
https://docs.tigera.io/calico-enterprise/next/operations/monitor/prometheus/byo-prometheus#scrape-metrics
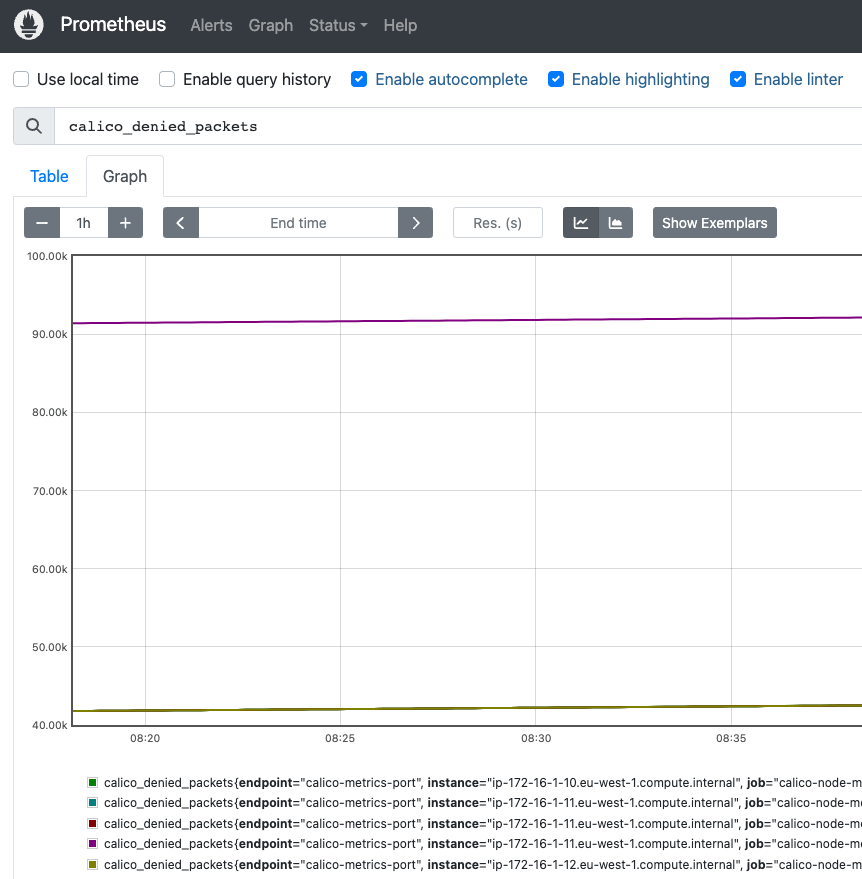
In the case below a servicemonitor has been created for calico-node-monitor in our monitoring namespace.You should see any service monitor created as Targets in Prometheus:
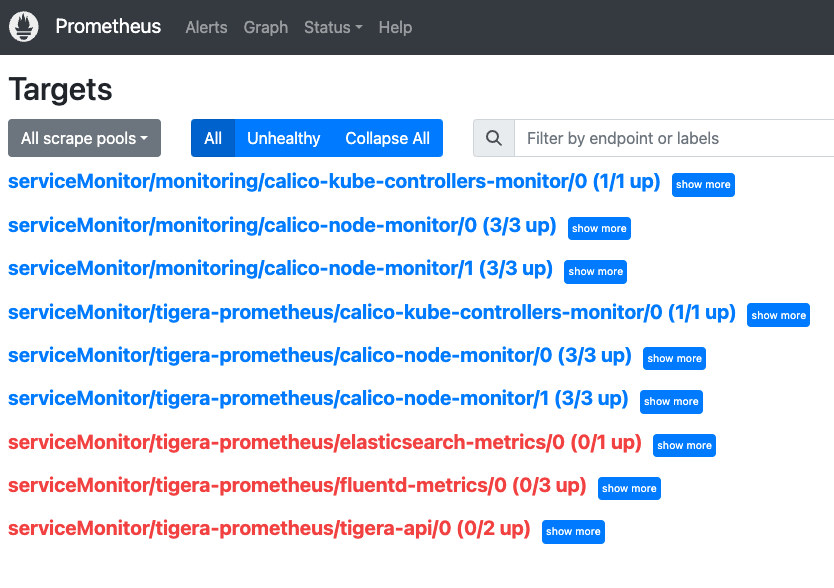
Next, check if you can explore the stats:
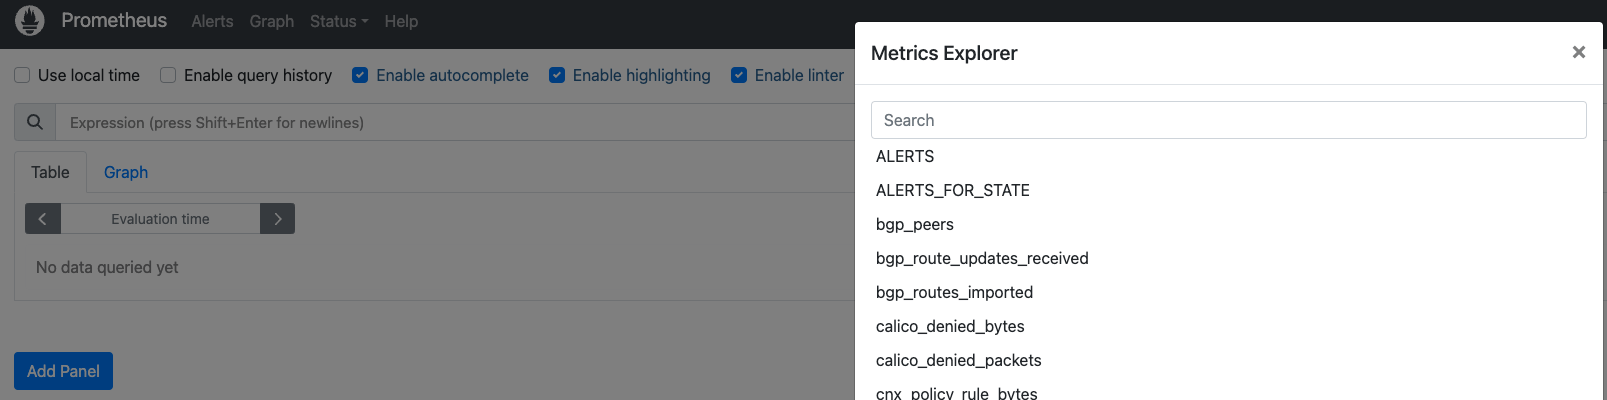
Metrics integration with Grafana
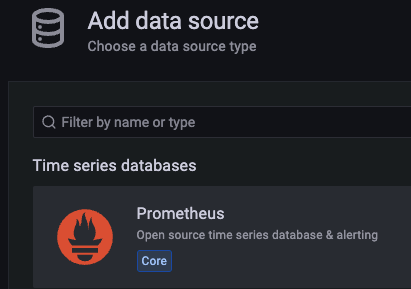
An alternative approach of scraping the stats in the main Prometheus resource would be using Grafana, and adding our prometheus server as a Source (So you do not have to modify your main Prometheus deployment):
Log into your Grafana console, then select the “Configuration” icon, and then “Data Sources” (or just click on “Add your first Data Source” in the main page). Then click the “Add Data Source” button, and select Prometheus as the option:
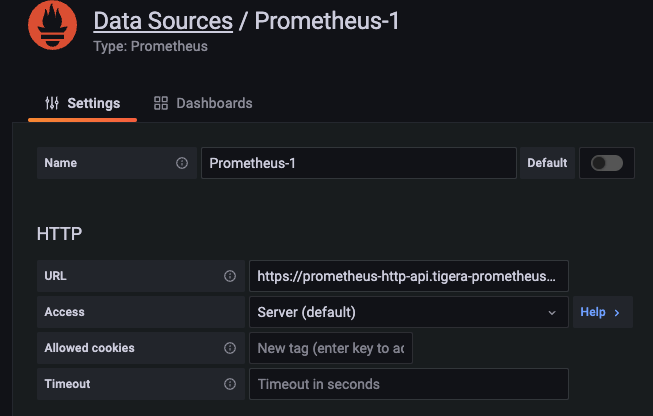
Give the Data Source any name, and select if you want this to be your default Data Source.
In the URL, you must add the service the Grafana pod will use to connect:
https://prometheus-http-api.tigera-prometheus.svc.cluster.local:9090
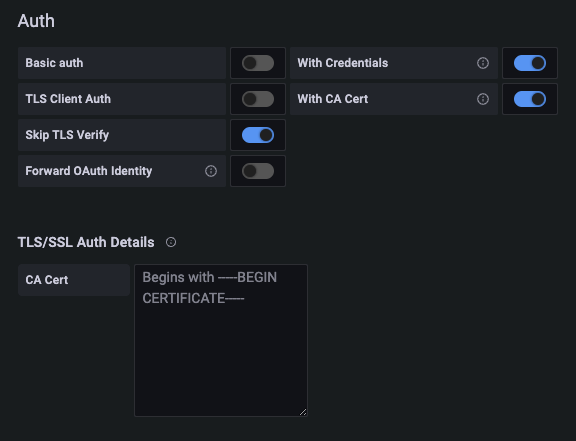
In the authentication section, enable “With Credentials”, “With CA Cert”, and “Skip TLS Verify”
Then in the TLS/SSL Auth Details, you must include in the “CA Cert” box the root certificate from the operator (Issuer tigera-operator-signer), which you can find in the configmap below:
kubectl get cm tigera-ca-bundle -n tigera-prometheus -o yaml
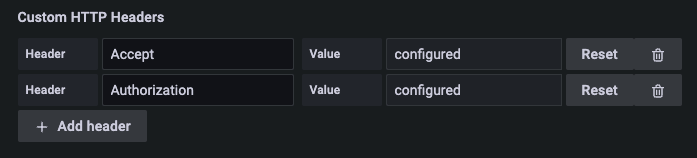
In the “Custom HTTP Headers” option, create the following two:
- Header: Accept / Value: application/json
- Header: Authorization / Value: Bearer <TOKEN>
You can use the token from any account with the role tigera-ui-user (preferred), or tigera-network-admin.
To check the token you select works, you can try gathering the metrics from any pod as:
curl -k -H "Accept: application/json" -H "Authorization: Bearer <TOKEN>" https://prometheus-http-api.tigera-prometheus.svc.cluster.local:9090/metrics
Leave the other parameters as default. Once you are done, click on the button “Save & test”, you should get a message saying the Data source is working:
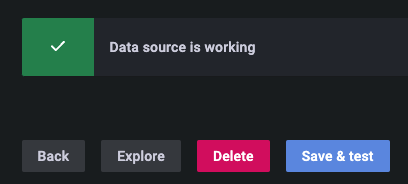
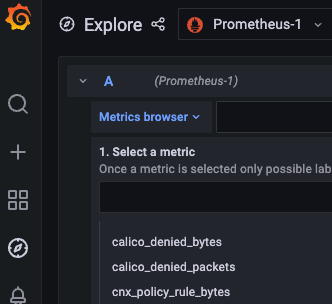
Now if you go to the Explore menu, and click in “Metrics browser”, you should be able to see Calico metrics:
Summary
As teams move to a microservices approach, it is critical to maintain, or even enhance the visibility of metrics we gather from the environment. Calico already builds robust observability, and exposes critical metrics, but those can be integrated to already existing monitoring services as Prometheus, or umbrella monitoring systems as Grafana.
Ready to try Calico for yourself? Get started with a free Calico Cloud trial.
Join our mailing list
Get updates on blog posts, workshops, certification programs, new releases, and more!