Distributed applications leverage multiple cross-connected services working together to deliver end-user functionality. These services are often maintained and updated by different teams, requiring Networking, Dev, DevOps, Platform, and Security teams to work in unison. There are many moving parts, as every aspect of the system can be modified by using a “kubectl apply -f <file>”. These factors make distributed applications very hard to troubleshoot. Traditional network troubleshooting tools do not work because of their lack of Kubernetes context, and their scalability limitations.
Downtime is very expensive and distributed application networking issues are difficult to troubleshoot. Platform, Networking and Security teams need an interface that can quickly and easily pinpoint the source of connectivity issues and facilitate the troubleshooting process. Security teams need an interface that can predict the behavior of microsegmentation policies. NOC and SOC teams need to be able to capture Kubernetes enriched logs in their logging and monitoring systems.
How does it work?
Calico Enterprise uses an Elasticsearch operator to deploy an Elasticsearch cluster and a Kibana instance. The Elasticsearch cluster is used to store flow logs according to specified retention settings to ensure the cluster does not run out of disk space. Elasticsearch and Kibana are integrated and managed as part of the Calico Enterprise lifecycle.
Architecturally, the logs are generated by the Calico data path component (Felix) into a file. The logs are pulled and transformed by a fluentd daemonset, and sent to Elasticsearch. Aggregation is handled by Felix. Filtering is handled by fluentd. Retention/recycling is handled by Elasticsearch.
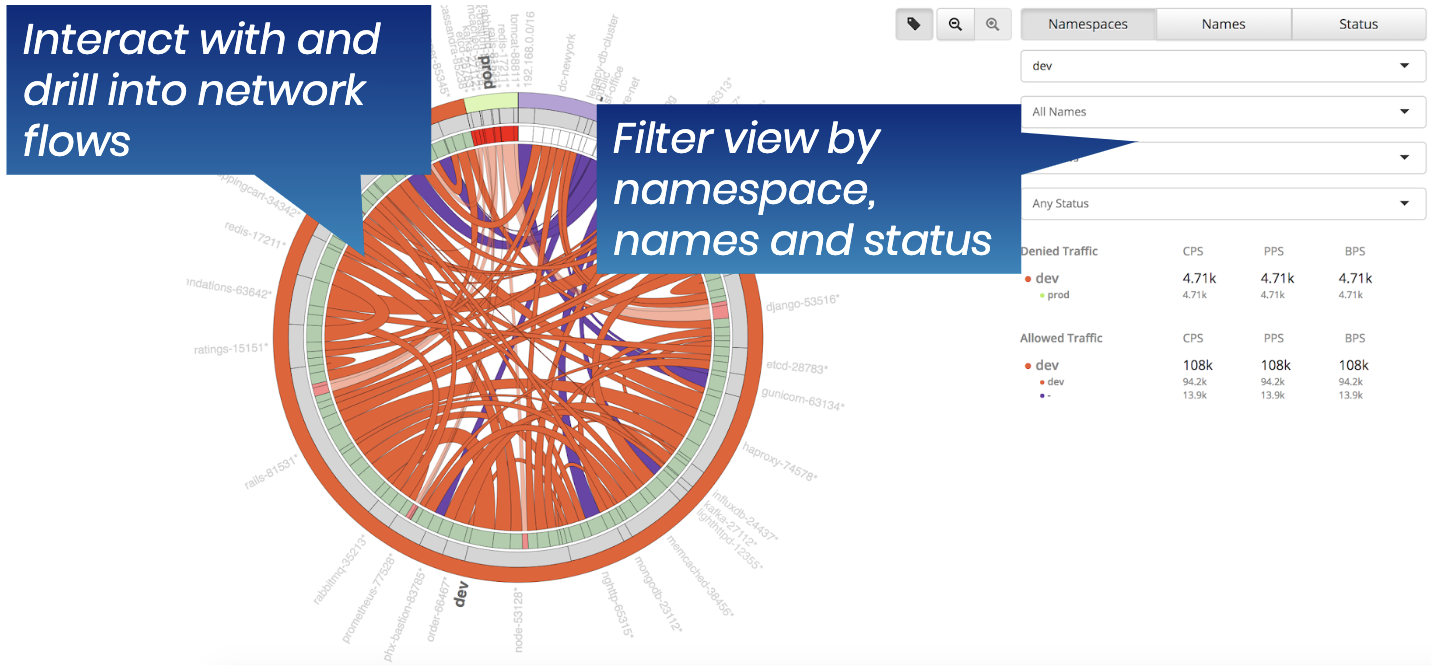
Flow logs provide a rich source of information about every network connection in your Kubernetes cluster. In addition to NetFlow information, flow logs capture source/destination pods, namespaces, labels and policies.
The diagram, below, shows how flow logs are displayed using the Calico Enterprise Flow Visualizer tool. It enables you to quickly drill down into a source-destination communication, and identify the root cause of a problem. Associated policies and allow/deny statistics simplify the troubleshooting process.
Why does this matter?
- Calico Enterprise flow logs enable you to trace the specific source/destination pod for any connection. By providing Kubernetes context (pod, labels, policy), we make it much easier for you to troubleshoot a given problem. This results in faster time-to-resolution, and less downtime.
- Network log retention is a requirement in most regulatory compliance mandates, and a necessity if you plan to conduct forensic analysis.
- Log retention can be costly in terms of data storage. Calico Enterprise provides tunable aggregation out of the box, which can help reduce storage costs by up to 90%.
How do I enable Flow Logs?
Flow logs are enabled by default. To use the flow logs, refer to the following interfaces:
- Flow Visualizer tool for connectivity and policy troubleshooting
- Kibana flow log interface for working with raw flow logs
- Kibana flow dashboard to use pre-build dashboards and create new ones
Review the flow logs, filtering flow logs, and RBAC for flow logs in this chapter.
https://docs.tigera.io/security/logs/elastic/
Join our mailing list
Get updates on blog posts, workshops, certification programs, new releases, and more!