Introduction
In the complex landscape of microservices within Amazon Elastic Kubernetes Service (EKS), maintaining seamless connectivity within microservices is paramount for ensuring optimal performance and reliability. As organizations increasingly embrace microservices architecture, understanding how to observe and troubleshoot microservices connectivity issues in Amazon EKS becomes a critical skill set. This concise guide will delve into essential tools, techniques and best practices to empower developers and administrators in mastering microservices connectivity within the EKS environment.
A. Brief on microservices in EKS
Microservices architecture, a paradigm that decomposes applications into smaller, independently deployable services, has gained widespread adoption, offering scalability, flexibility, and easier maintenance. In the context of the EKS, microservices are orchestrated using Kubernetes as a managed service provided by Amazon AWS. The EKS simplifies the deployment and management of containerized applications, allowing for efficient scaling and resource utilization.
Within Amazon EKS, microservices are organized into containers, enabling developers to package and deploy applications seamlessly. This modular approach enhances agility, allowing teams to update and scale specific components without disrupting the entire application. Understanding the intricacies of microservices within the EKS is crucial for harnessing the full potential of this architecture and, more importantly, for addressing and resolving connectivity challenges that may arise. In the sections that follow, we will explore the tools, techniques, and best practices essential for observing and troubleshooting microservices connectivity in the EKS environment.
B. Significance of microservices connectivity observation and troubleshooting
Microservices rely on intricate networks to seamlessly interact with one another, forming the backbone of modern, distributed applications. Any disruption in connectivity can lead to degraded performance, increased latency, and potential service outages.
As organizations increasingly migrate to microservices architectures hosted on the EKS, the ability to navigate and mitigate connectivity challenges becomes a crucial aspect of system reliability and user satisfaction. This guide aims to equip practitioners with the tools and insights needed to observe and troubleshoot microservices connectivity effectively within the EKS environment, ensuring a robust and resilient application ecosystem.
Tools and Techniques
This section provides an exploration of Calico’s observability tools tailored for the EKS environments. From monitoring solutions like Prometheus to visualization tools such as Dynamic Service and Threat Graph, we’ll delve into the essential technologies that empower administrators and developers to gain insights into the intricacies of microservices communication. Additionally, we’ll explore practical techniques for identifying and troubleshooting common connectivity issues, ensuring a proactive stance in maintaining a resilient and high-performing microservices architecture within the EKS.
A. Overview of observability tools
In the realm of Amazon EKS, leveraging observability tools tailored to the specific demands of microservices is paramount. Calico Enterprise and Cloud, a powerful networking, security, and observability solution, takes center stage in this section. We’ll delve into the functionalities of Calico Enterprise and Cloud, exploring how it facilitates robust observability in the EKS environments. From real-time monitoring to in-depth insights into network traffic, Calico Enterprise and Cloud provides a comprehensive suite of tools designed to enhance the visibility of microservices interactions. This section will guide you through the features of Calico Enterprise and Cloud and demonstrate its role in elevating the observability of microservices, ensuring a proactive stance in identifying and addressing connectivity challenges within the dynamic EKS ecosystem.
B. Troubleshooting common connectivity issues
1. Service Network Latency and Connection Quality Analysis:
1.1 Explore Calico’s capabilities for analyzing service connection quality.
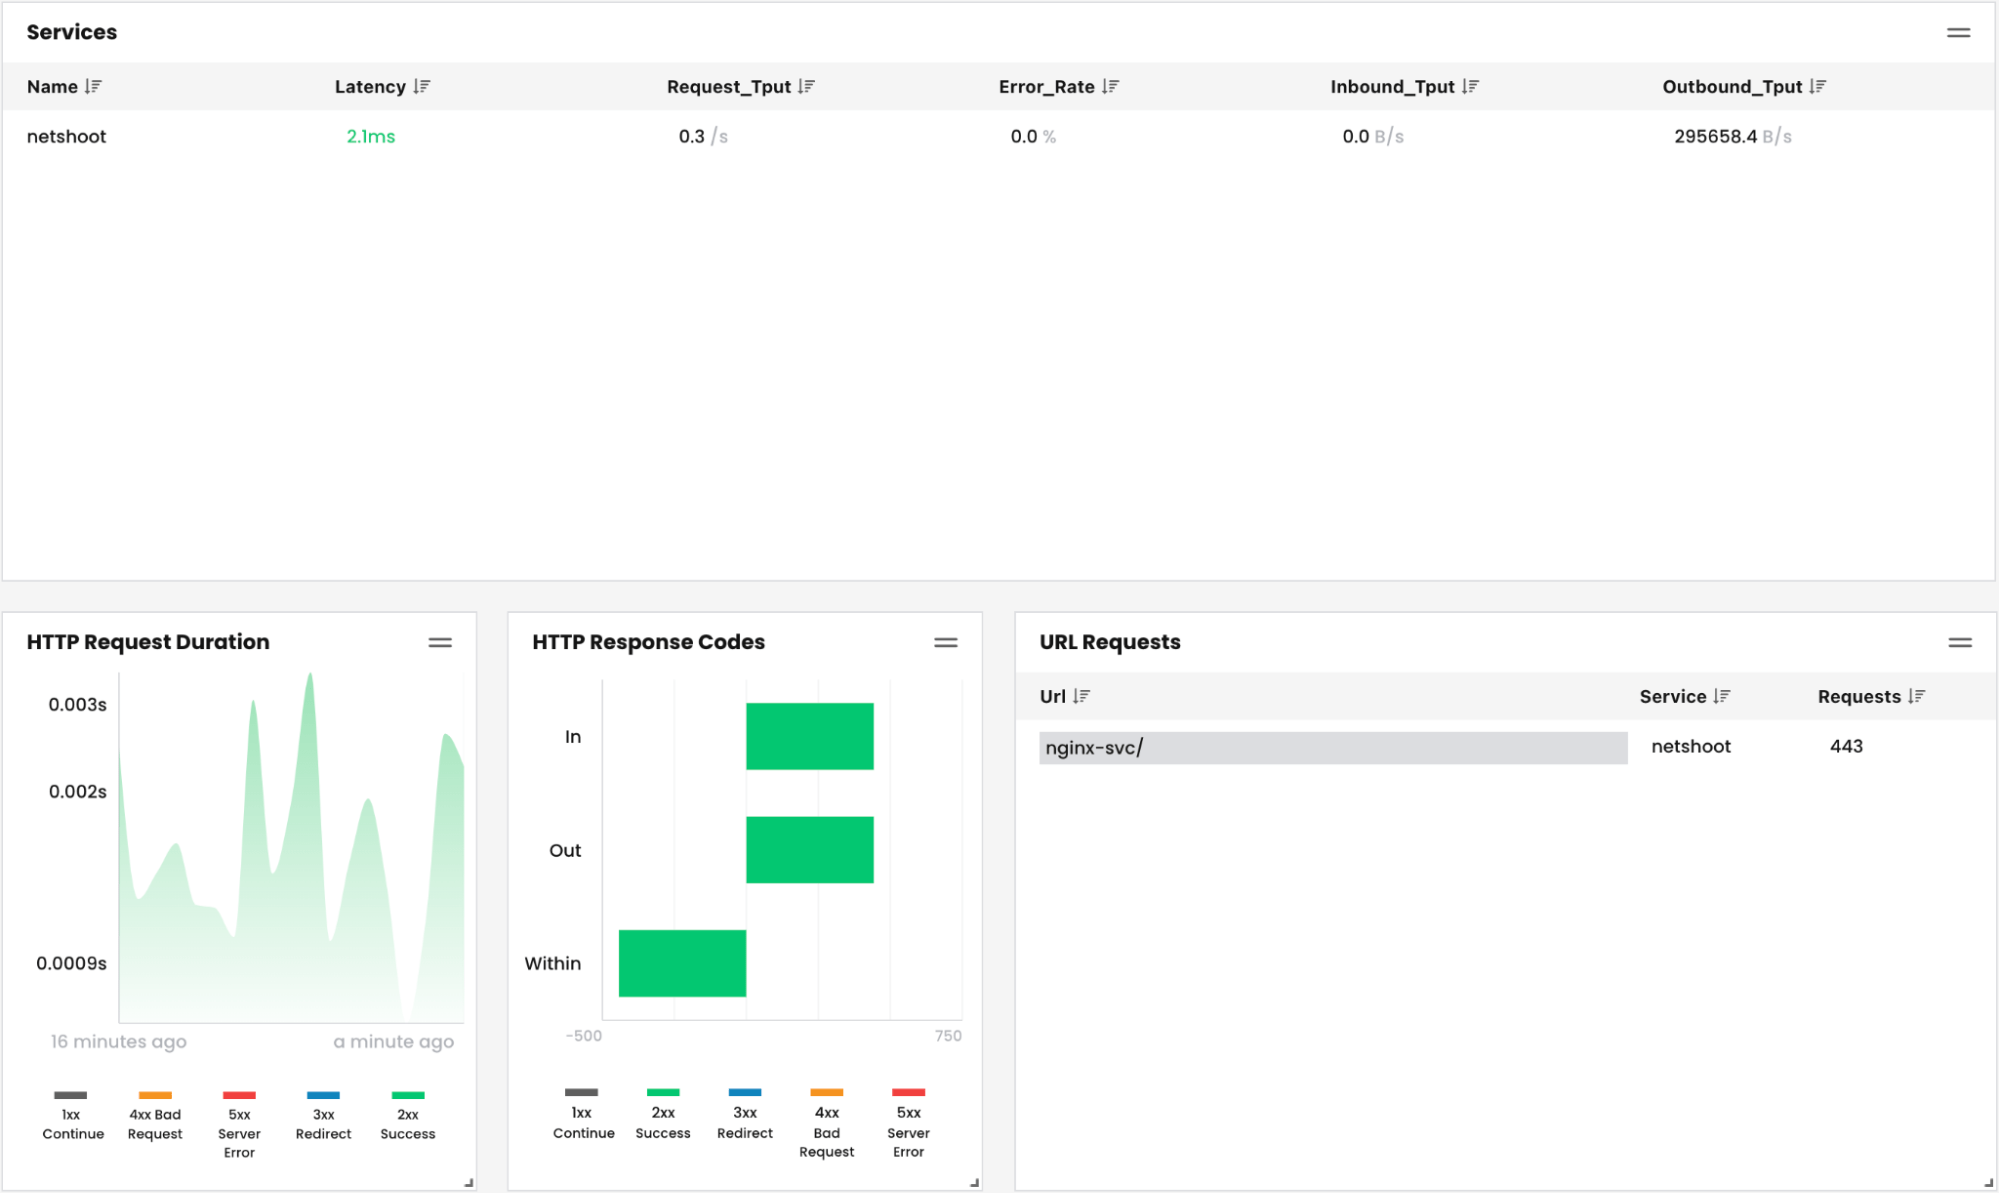
Calico offers application level logs that allow users to get service request latency and duration. These metrics are helpful to monitor service quality when connection latency increases. You can see these metrics in the Services and HTTP Request* widgets on the Dashboard view:
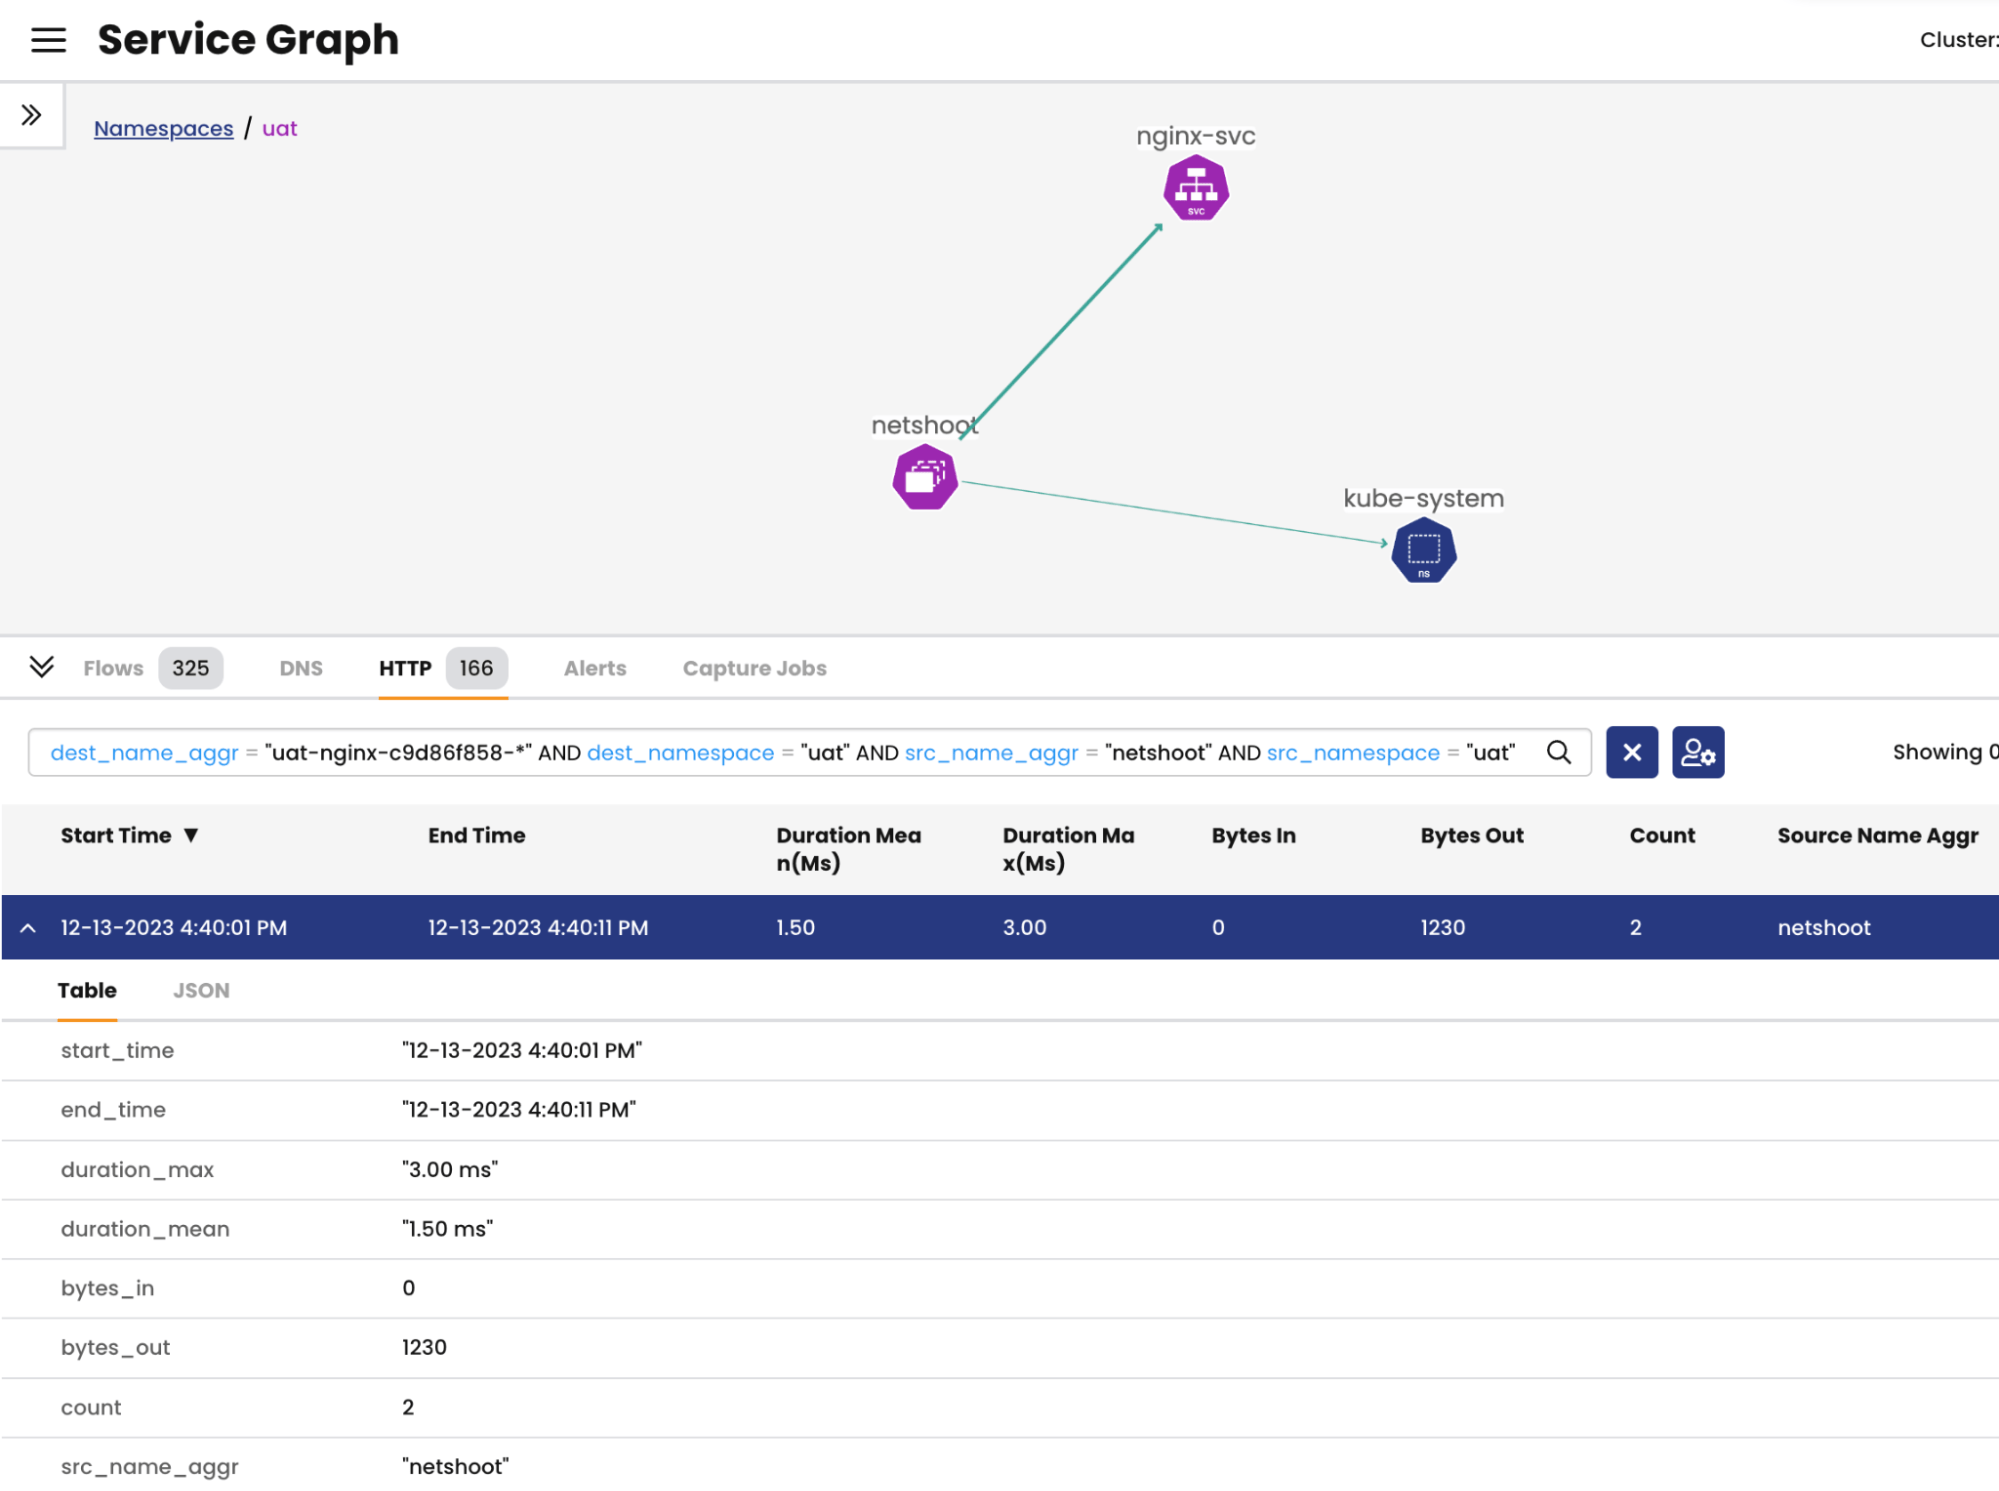
or by looking into HTTP logs in the Service Graph view:
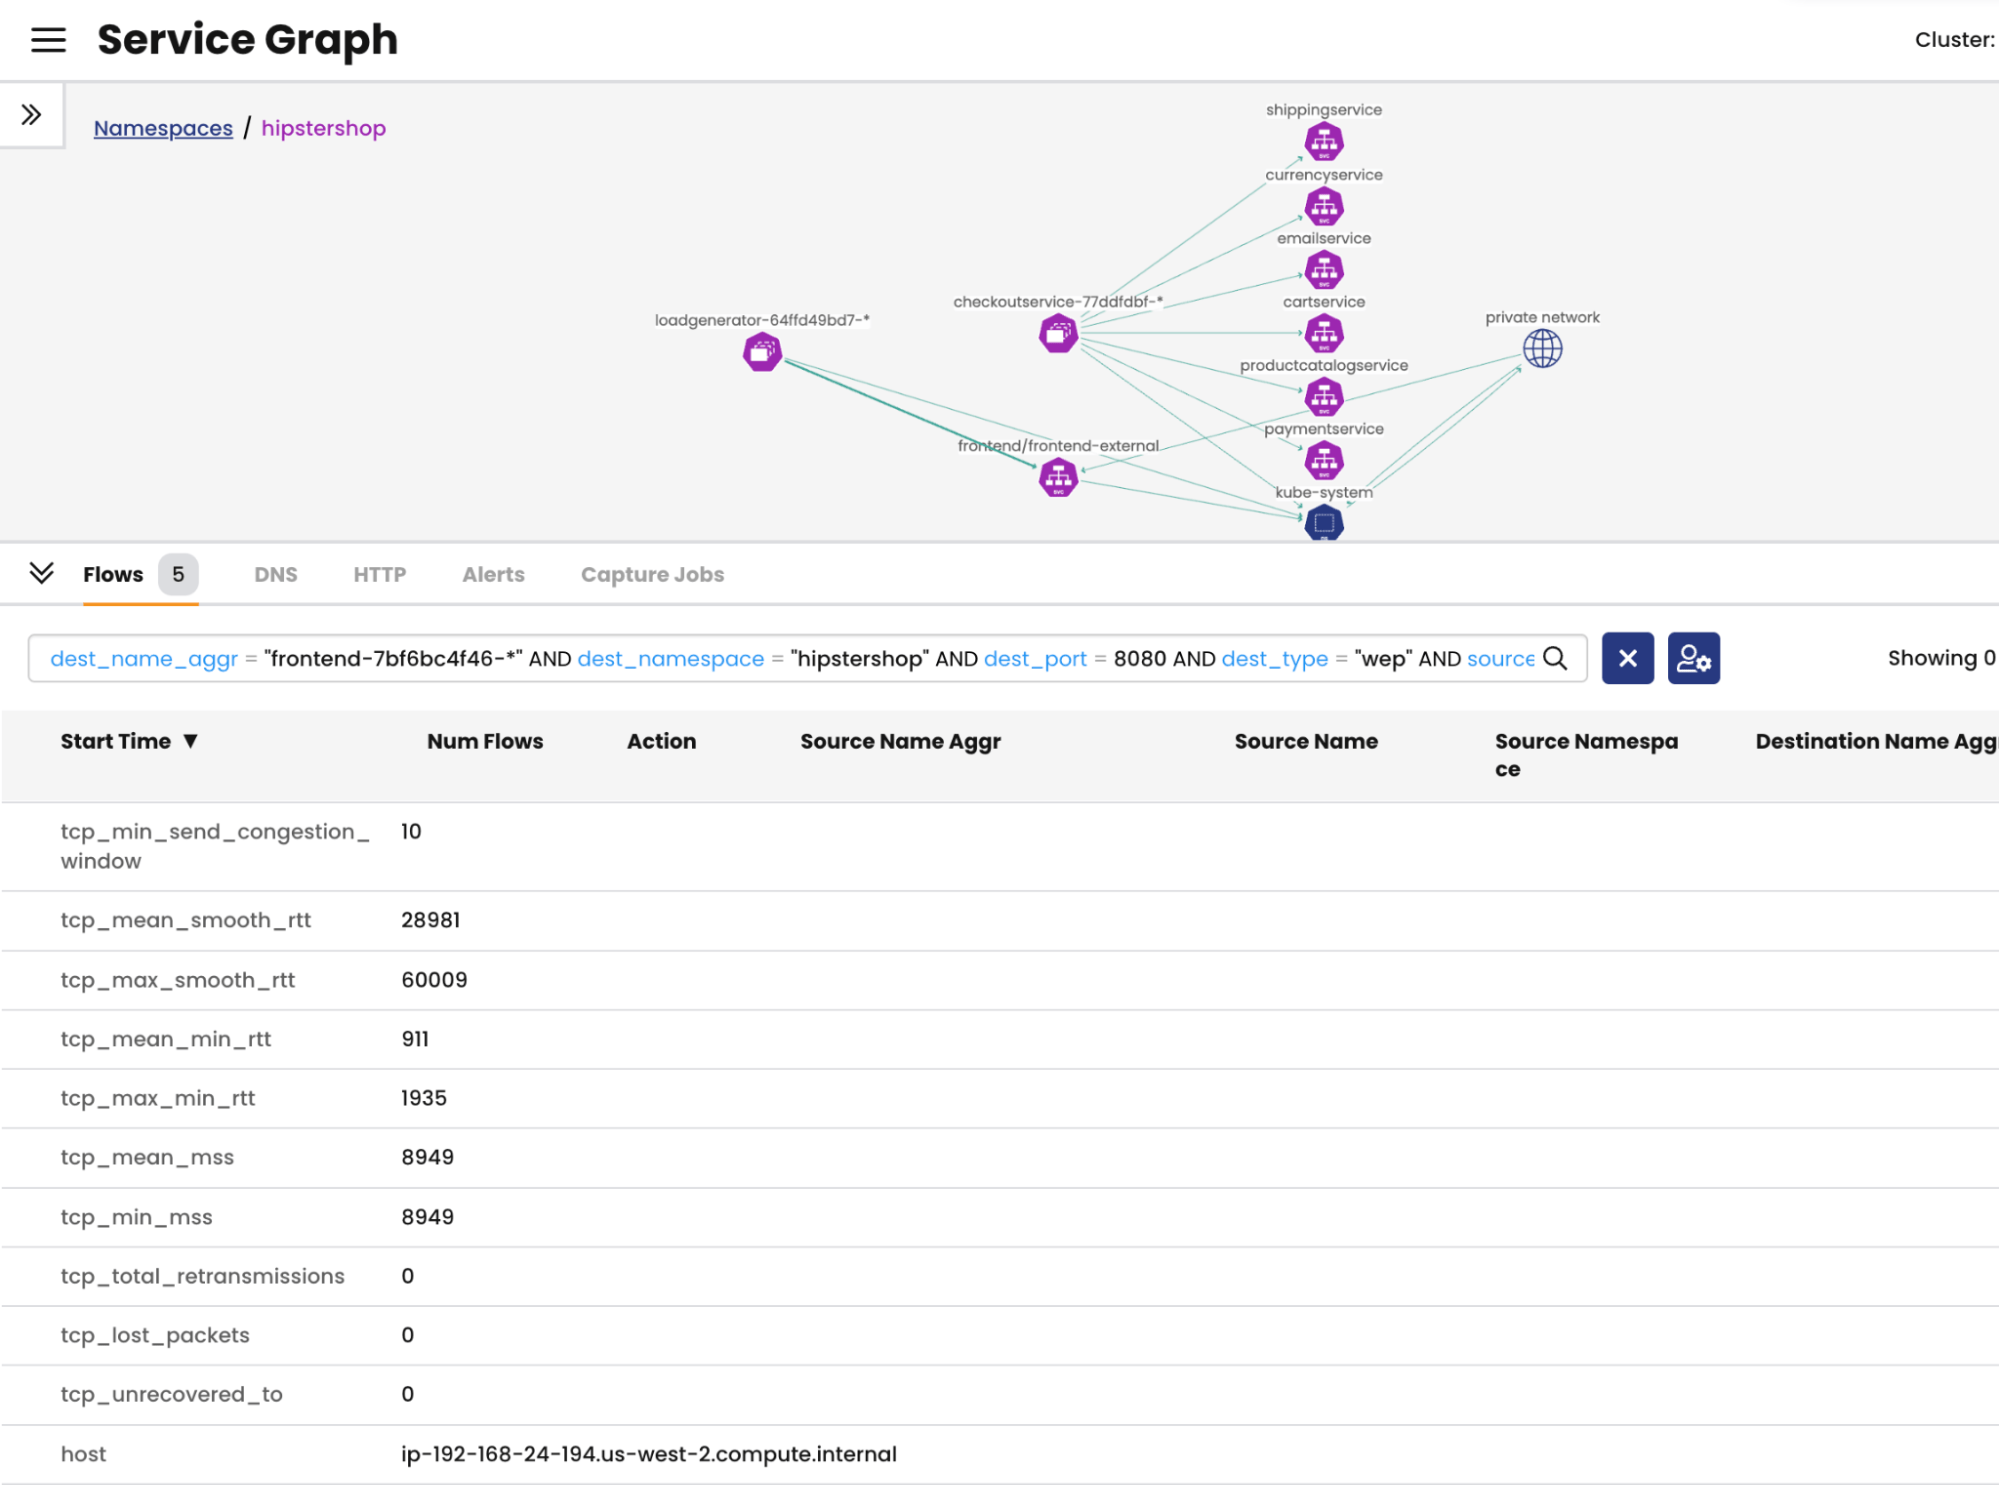
1.2 Understand how to interpret TCP stats and HTTP request duration metrics to identify potential bottlenecks.
Calico flow logs allow you to get insights into TCP connection performance by analyzing the TCP socket stats. Note that the TCP socket stats need to be enabled for the information to be included into the flow logs. The *RTT metrics allow service reliability engineers to keep an eye on quality of connections. They can also leverage Calico’s alerting system to get notified if connections degrade.
2. Service Discovery and Endpoint Visibility:
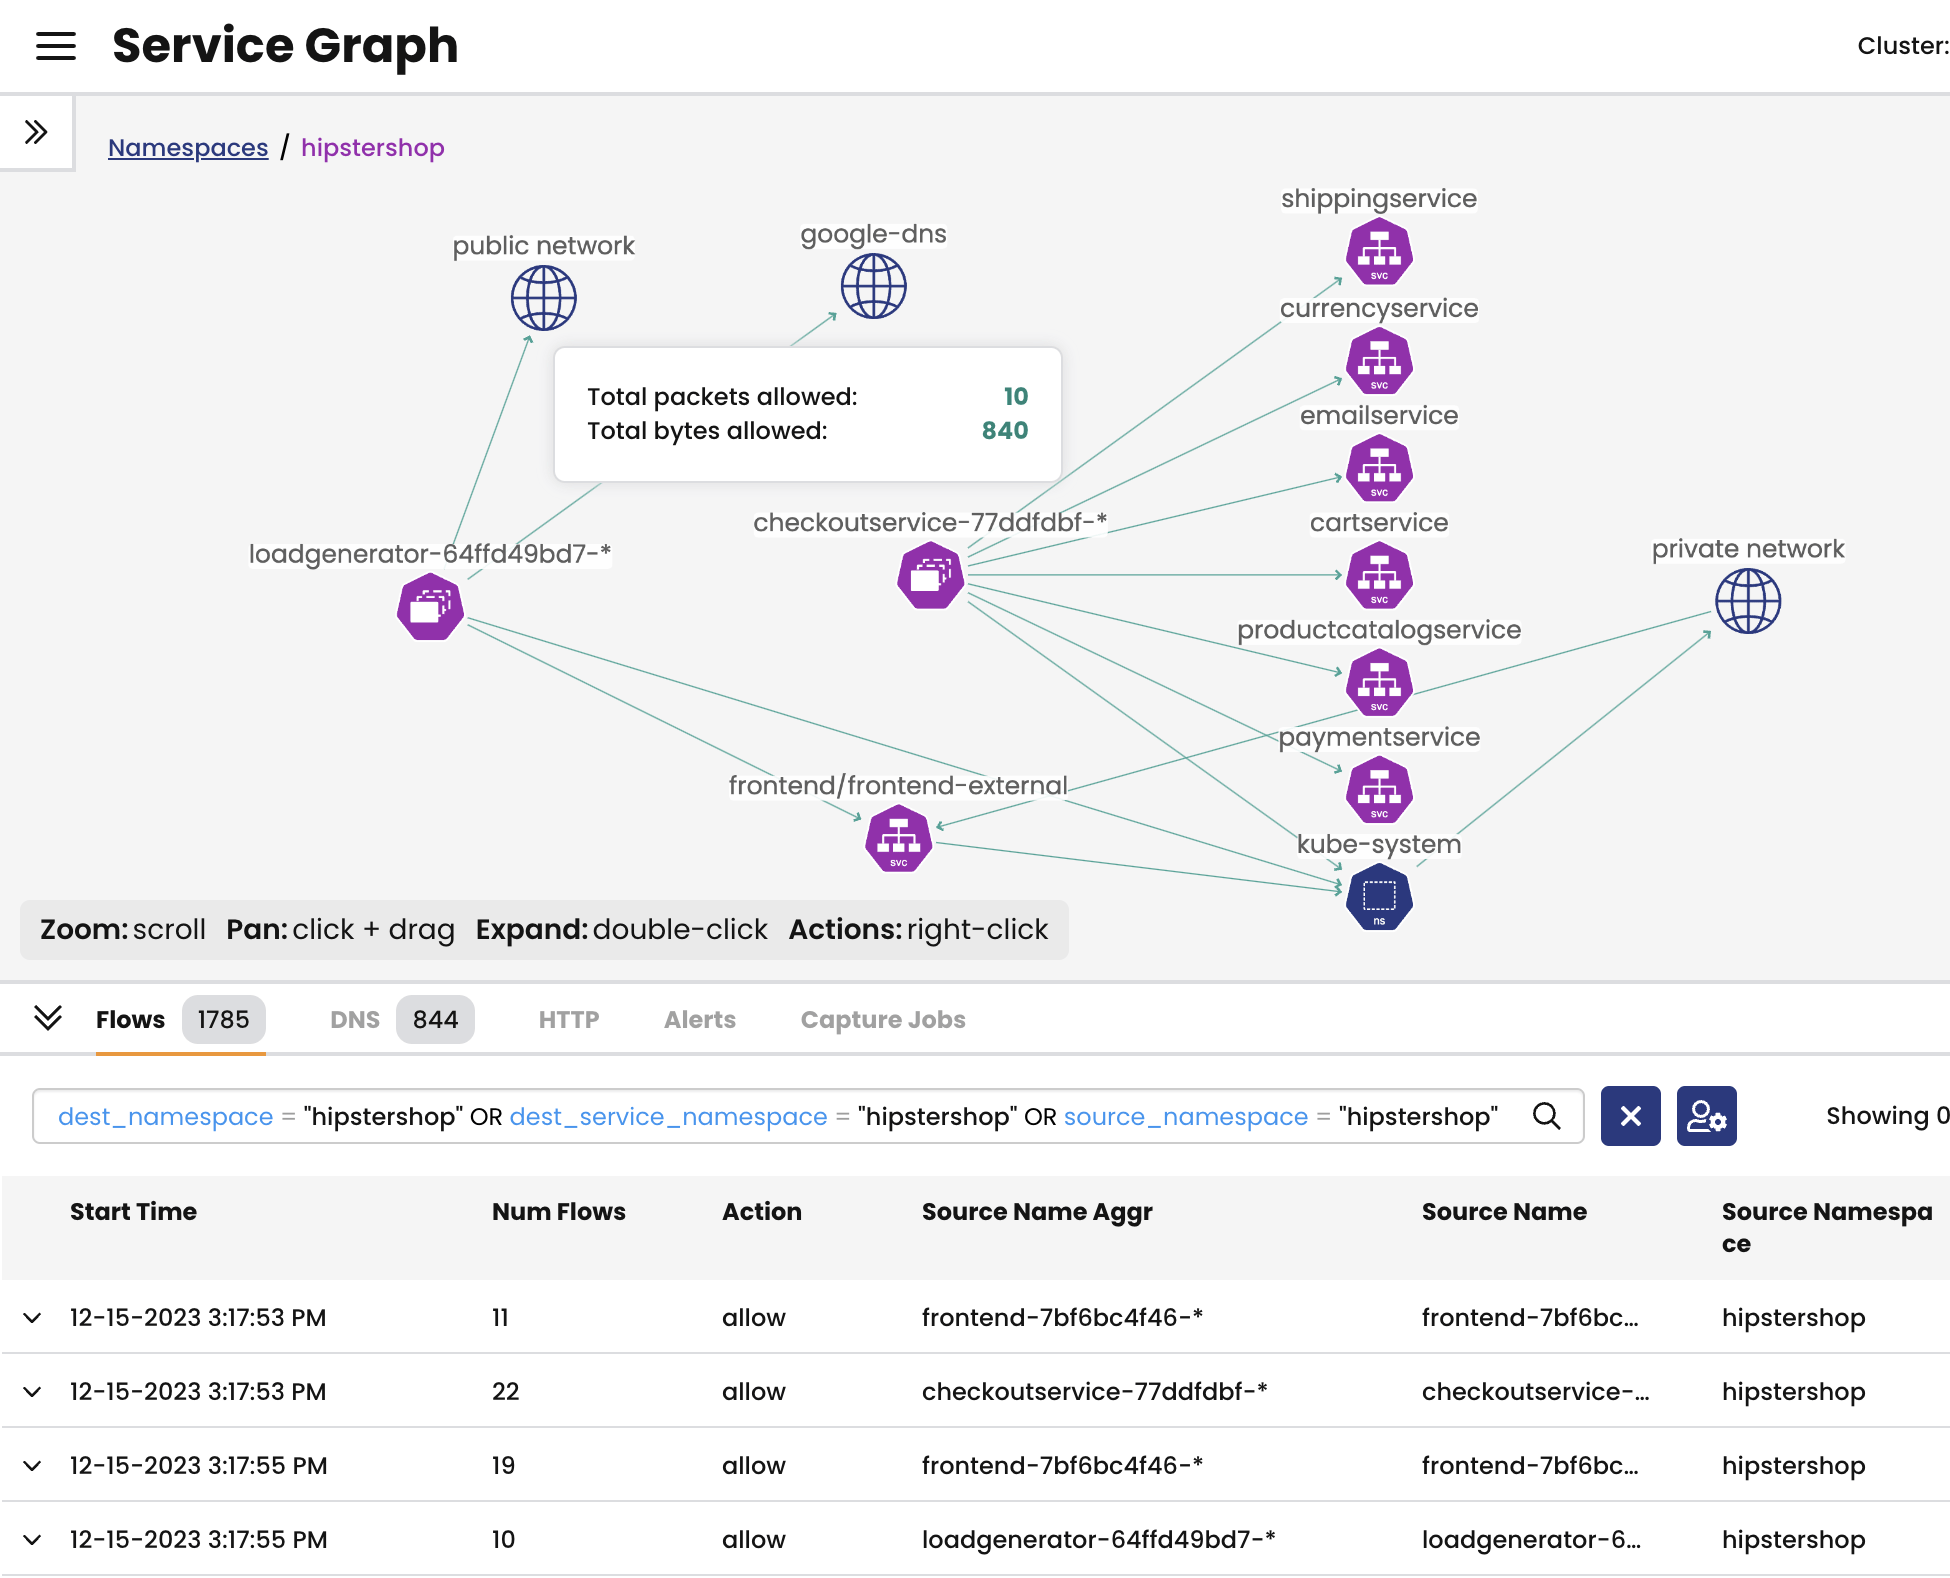
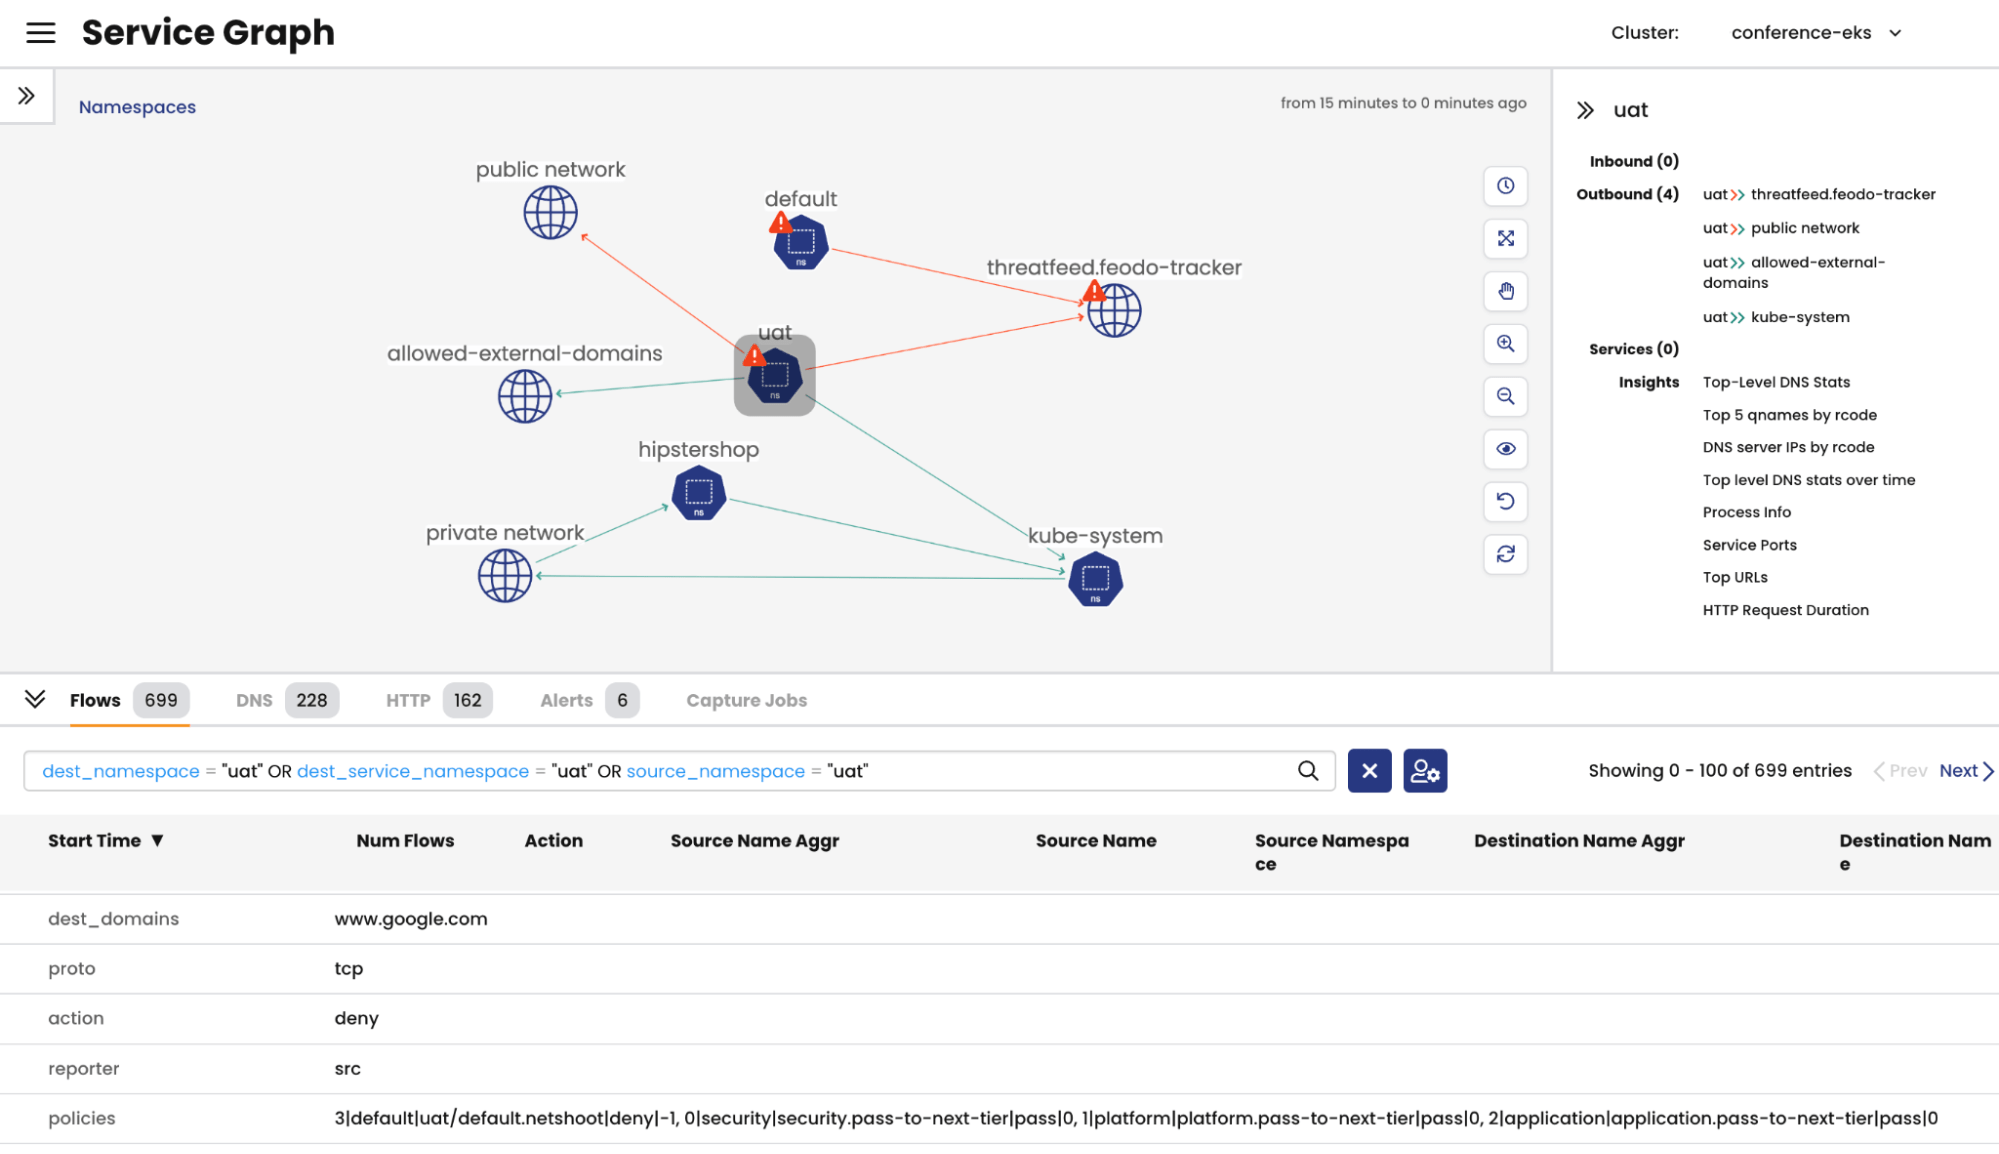
Utilize Calico Enterprise/Cloud to enhance service discovery mechanisms. The Service Graph tool allows users to easily identify which services talk to each other or external endpoints and quickly get all relevant information.
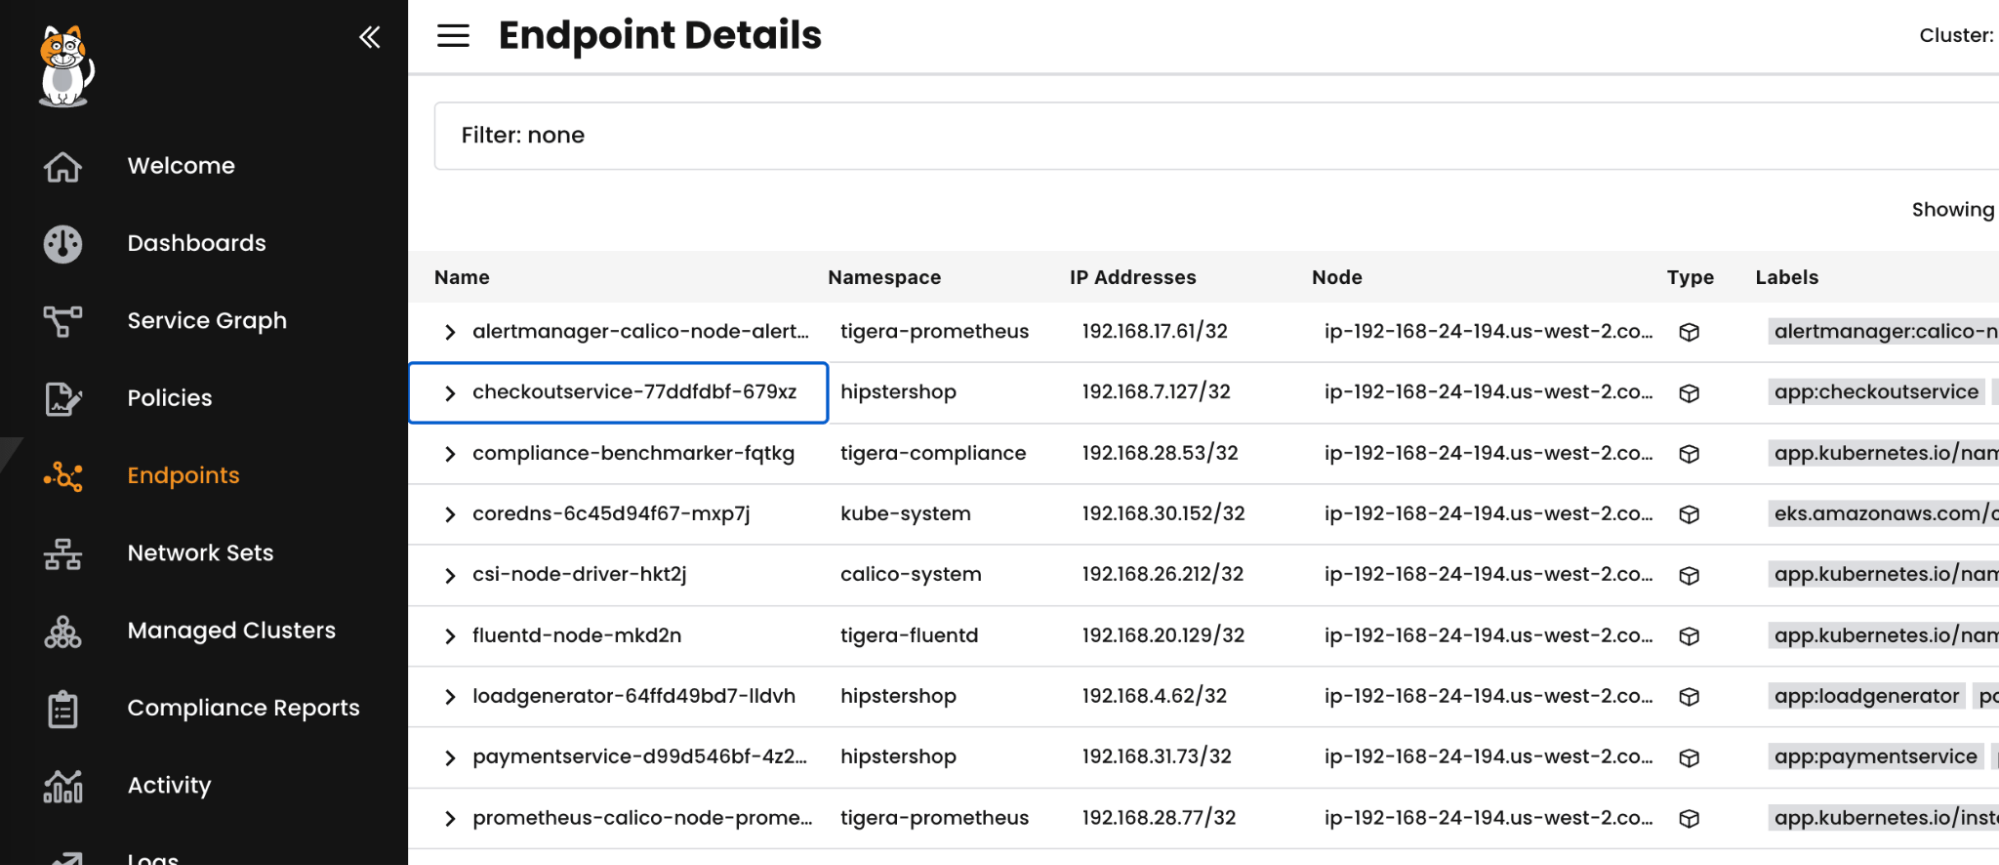
Gain insights into endpoint visibility for a comprehensive understanding of microservices interactions. Besides the Service Graph that provides visual cues what endpoints services communicate with, there is the Endpoints view that offers intrinsic details about each Kubernetes endpoint as well as host endpoints and makes it easy to figure out which policies govern connections for those endpoints and get quick access to that intrinsic metadata.
3. Security Policy Misconfigurations:
Address security concerns with Calico Enterprise/Cloud’s security policies. Calico offers a hierarchical policy management structure that allows security, platform, application, and other teams to configure security guardrails at a higher level and then tighten security down to specific services.
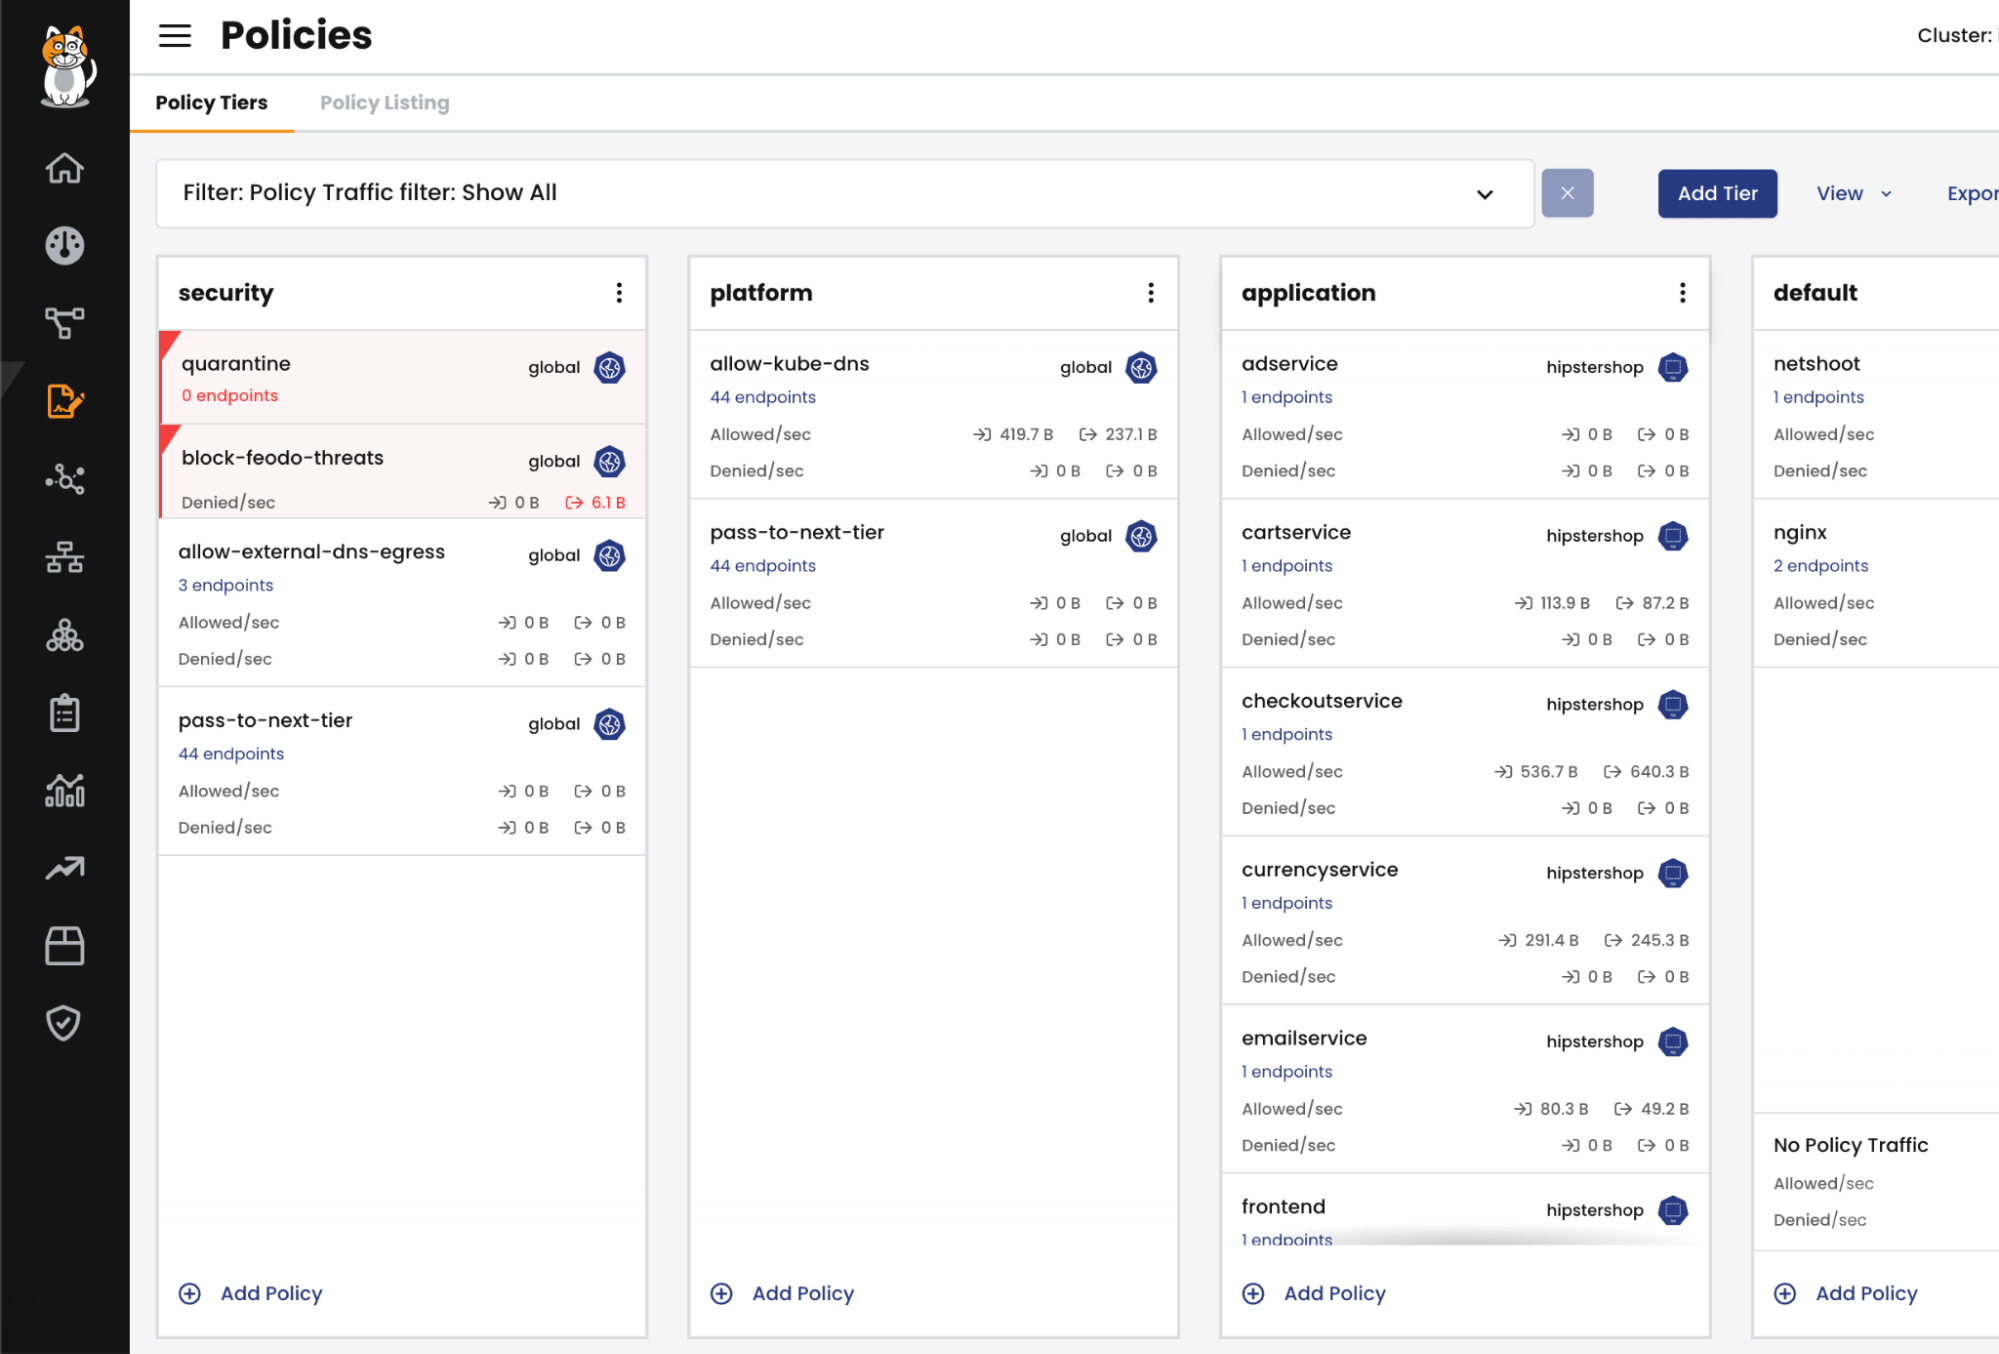
Identify and rectify security policy misconfigurations affecting microservices communication. Using Service Graph you can easily pinpoint a policy misconfiguration that blocks or allows communications or which communications have laxed security configuration.
By harnessing the capabilities of Calico Enterprise/Cloud, administrators and developers can proactively troubleshoot connectivity issues, ensuring a resilient and high-performance microservices architecture within the dynamic context of Amazon EKS. This section aims to empower users with practical insights into leveraging Calico Enterprise/Cloud for effective troubleshooting in real-world scenarios.
III. Best Practices
This section offers an overview of recommended strategies for configuring networking, implementing security measures, and ensuring optimal scalability within the EKS environment. From fine-tuning network configurations to leveraging Kubernetes Network Policies effectively, these best practices serve as a guide for fostering a robust and reliable microservices architecture. By adhering to these recommendations, practitioners can enhance the performance, security, and resilience of their microservices deployments on EKS.
Achieving optimal observability and efficient troubleshooting in microservices deployments on Amazon EKS demands a strategic reliance on Calico Enterprise/Cloud. This section delves into best practices that leverage Calico Enterprise/Cloud’s capabilities for comprehensive observability and effective issue resolution.
A. Leveraging Calico Enterprise/Cloud for Observability of Microservices on EKS
1. Real-time Observability with Calico Enterprise/Cloud Monitoring:
Calico offers a number of tools that allow users to observe and monitor services running in EKS clusters:
- The Dashboard view offers a collection of widgets that allow users to see how traffic moves through existing policies in the cluster, whether any policies deny any traffic, or monitor the service connection latency and DNS requests resolution.
- Explore Calico Enterprise/Cloud’s real-time monitoring metrics to gain insights into microservices behavior, monitor health of the cluster as well as performance and stability of the cluster network.
- Utilize the Service Graph visualizations and metrics provided by Calico Enterprise/Cloud for proactive observability.
2. Troubleshooting with Calico Enterprise/Cloud:
The Service Graph visualizations allow users to quickly understand which services communicate with internal or external endpoints, understand which services triggered security or configuration alerts, or launch a packet capture for any given service or an entire namespace.
3. Dynamic Security Policies for Issue Prevention:
Implement dynamic security policies with Calico Enterprise/Cloud to prevent potential connectivity issues. Leveraging Policy Impact tool and Staged policies allows users to implement a full policy lifecycle process to catch any misconfigurations before the policy gets enforced.
Moreover, Policy Recommendation tool offers users an automated way to create security policies based on observed services communications behaviors. Using GitOps methods to manage Calico policies as a code simplifies policy management process, makes it repeatable, and scalable.
By incorporating Calico Enterprise/Cloud into observability and troubleshooting workflows, practitioners can streamline their efforts, identifying and resolving connectivity issues with agility. This section aims to empower users with practical insights into maximizing the potential of Calico Enterprise/Cloud for maintaining a resilient and high-performance microservices architecture within the dynamic context of EKS.
B. Implementing effective troubleshooting strategies
Navigating the dynamic landscape of microservices within the EKS demands a strategic and effective approach to troubleshooting. This section outlines best practices for implementing troubleshooting strategies that ensure swift issue identification and resolution.
1. Proactive Monitoring and Alerts:
- Establish a robust monitoring framework using tools like Calico Enterprise/Cloud, Prometheus and Kibana.
- Implement proactive alerts to swiftly detect anomalies and potential connectivity issues.
2. Collaborative Debugging with Kubernetes Events:
- Utilize Calico’s alerting system, packet captures and Kubernetes events for collaborative debugging and issue tracking.
- Enhance communication between development and operations teams for quicker issue resolution.
3. Documentation and Knowledge Sharing:
- Establish comprehensive documentation for common troubleshooting scenarios.
- Encourage knowledge sharing within the team to build a collective troubleshooting expertise.
By adopting these troubleshooting strategies, teams can enhance their ability to identify and resolve connectivity issues efficiently, fostering a resilient microservices architecture within the dynamic environment of the EKS. This section aims to equip practitioners with actionable insights for implementing effective troubleshooting practices and maintaining a high-performance microservices ecosystem.
Ready to try Calico node-specific policies? Sign up for a free trial of Calico Cloud
Join our mailing list
Get updates on blog posts, workshops, certification programs, new releases, and more!