In Kubernetes, the Domain Name System (DNS) plays a crucial role in enabling service discovery for pods to locate and communicate with other services within the cluster. This function is essential for managing the dynamic nature of Kubernetes environments and ensuring that applications can operate seamlessly. For organizations migrating their workloads to Kubernetes, it’s also important to establish connectivity with services outside the cluster. To accomplish this, DNS is also used to resolve external service names to their corresponding IP addresses. The DNS functionality in Kubernetes is typically implemented using a set of core-dns pods that are exposed as a service called kube-dns. The DNS resolvers for workload pods are automatically configured to forward queries to the kube-dns service.
The output below shows the implementation of the kube-dns services in a Kubernetes cluster.
kubectl get service kube-dns -n kube-system
NAME       TYPE        CLUSTER-IP     EXTERNAL-IP   PORT(S)
kube-dns   ClusterIP   10.0.0.10      <none>        53/UDP,53/TCP
The core-dns pods have to rely on external DNS servers to perform domain name resolution for services outside the cluster. By default, the pods are configured to forward DNS queries to the DNS server configured in the underlying host in the /etc/resolv.conf file. The output below displays the DNS forward configuration in the “coredns” configmap.
kubectl get configmap coredns -n kube-system -o yaml
apiVersion: v1
data:
Corefile: |
.:53 {
errors
ready
health
kubernetes cluster.local in-addr.arpa ip6.arpa {
pods insecure
fallthrough in-addr.arpa ip6.arpa
}
prometheus :9153
forward . /etc/resolv.conf
cache 30
loop
reload
loadbalance
import custom/*.override
}
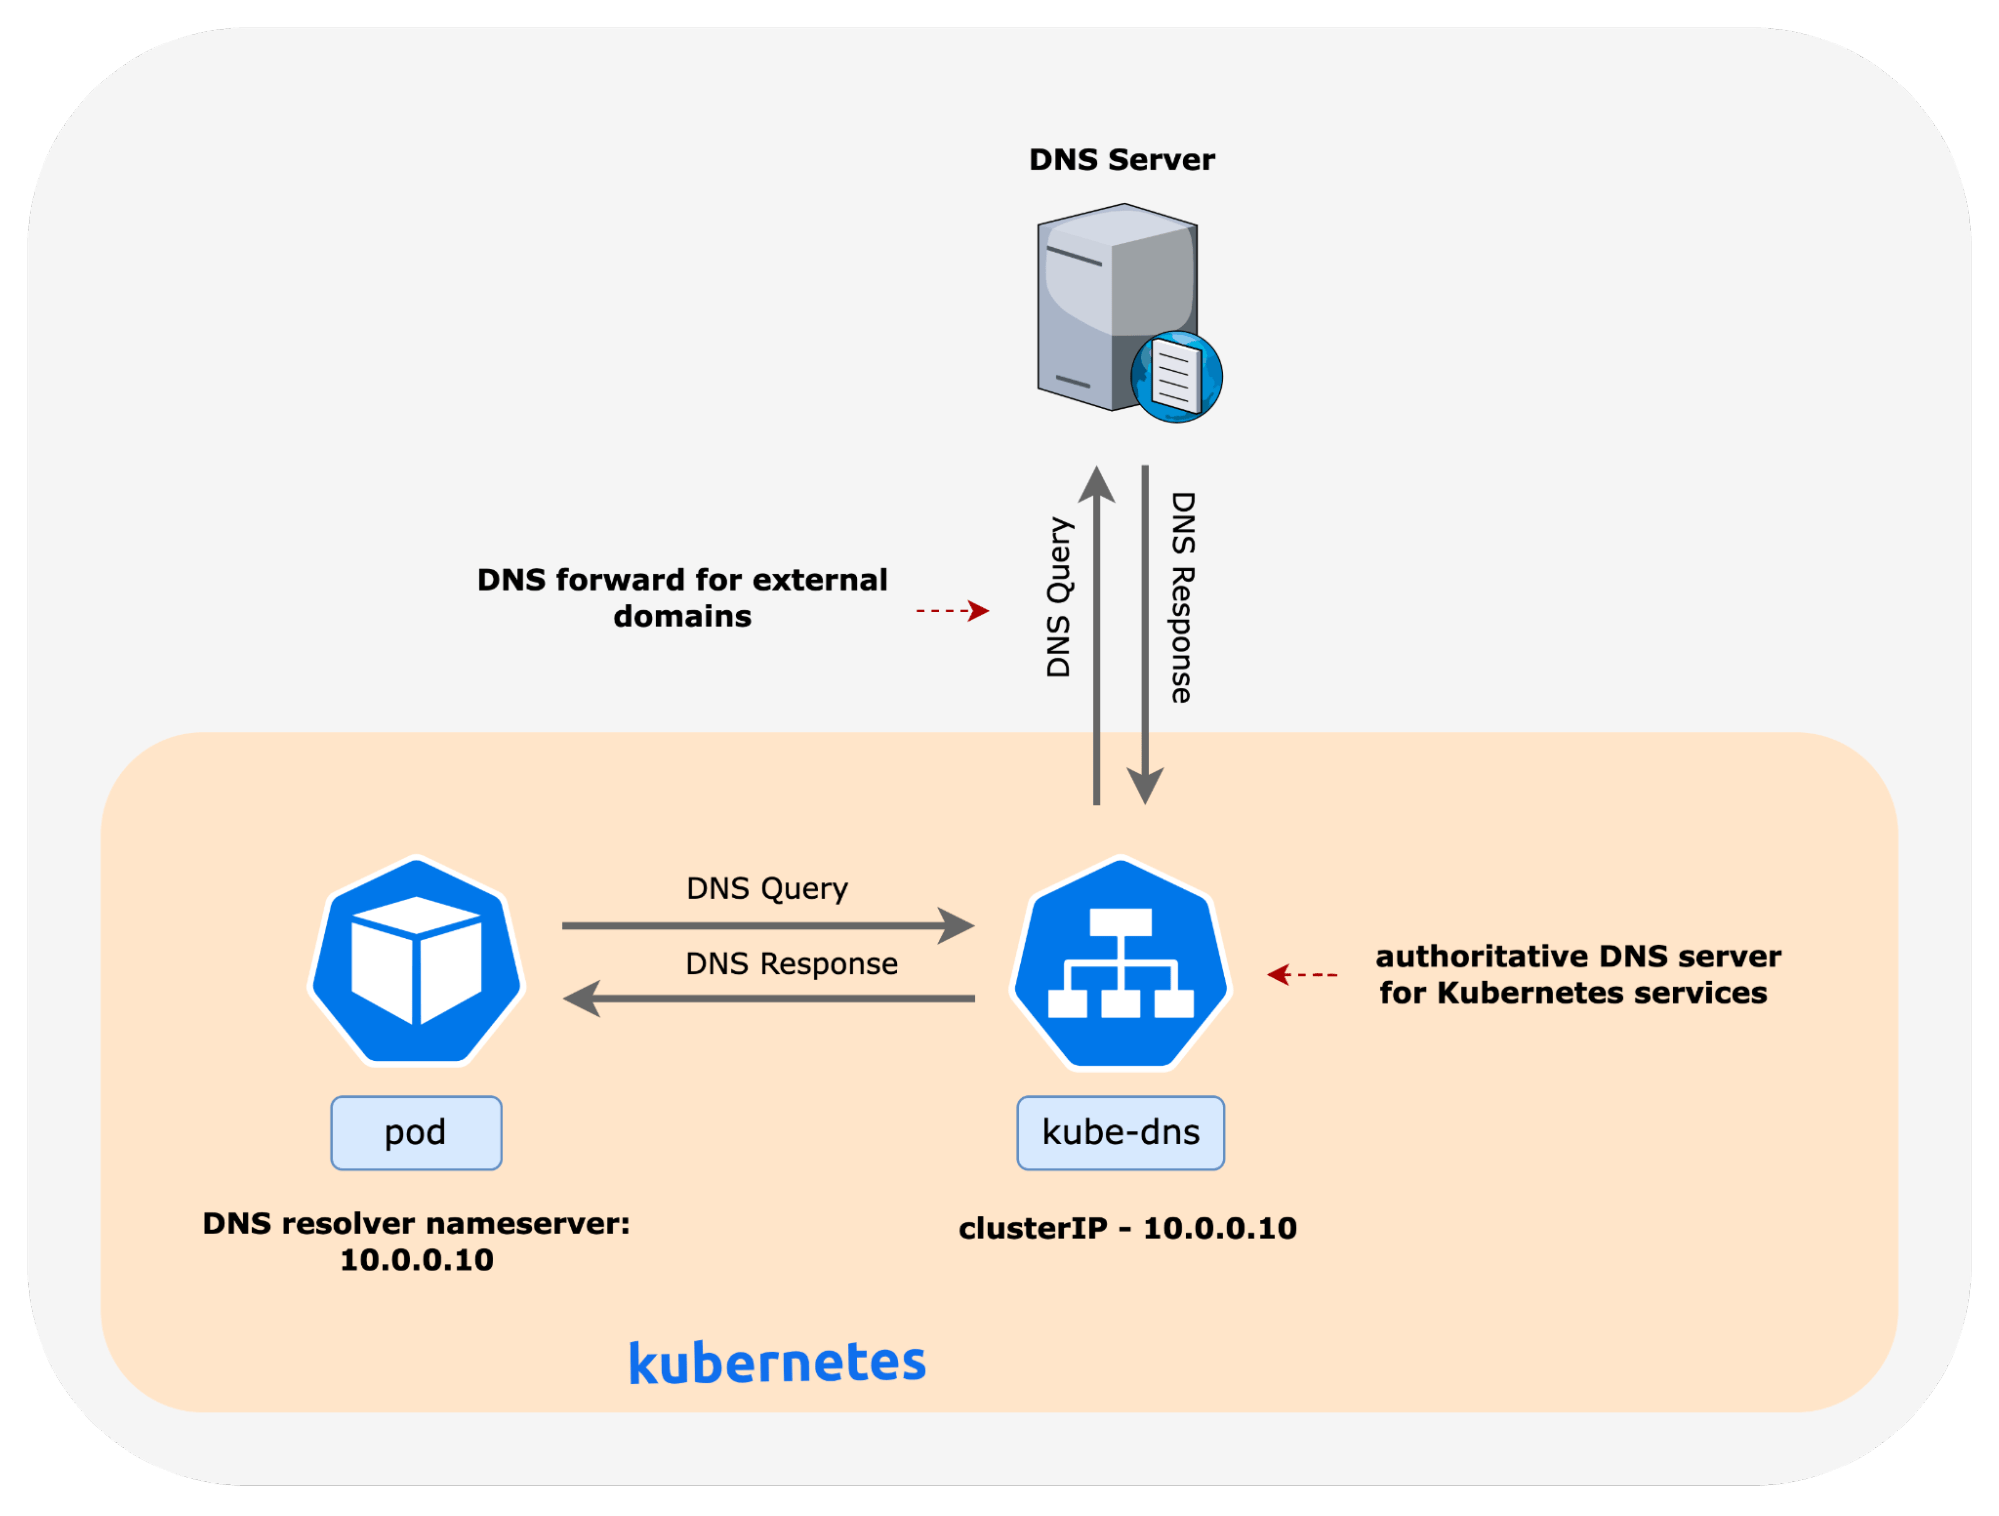
import custom/*.serverThe image below provides a high-level overview of DNS query and response packets for services inside and outside the Kubernetes cluster. In the example shown, the IP address of the kube-dns service is 10.0.0.10, and the pod DNS resolver points to the same.
DNS Challenges in Kubernetes
Problems with DNS can have a significant impact on the performance and reliability of applications running in Kubernetes. These issues can arise due to misconfigurations, failures, or performance degradation of the DNS infrastructure. DNS errors can manifest in various ways, such as application latency, transaction timeouts, or poor end-user experience. These issues can be sporadic, making it difficult to diagnose and resolve, resulting in prolonged downtime and frustration for application and DevOps teams. Furthermore, the DNS infrastructure in Kubernetes also interacts with upstream DNS servers for external domain name lookups. The DNS query may have to pass through several DNS servers and recursive lookups before the response is provided to the client. As a result, issues outside the Kubernetes cluster, such as problems with the upstream DNS servers, can also impact the performance of applications running in the cluster. It is vital to have in-depth DNS observability to troubleshoot complex DNS issues to ensure application robustness in Kubernetes clusters.
DNS Observability in Calico
Calico offers several DNS observability features to help DevOps and service owners gain deep visibility into the behavior and performance of DNS in the cluster and individual workloads; these features include:
- DNS logs
- Service and Threat Graph
- DNS dashboard
DNS Logs
Calico provides out-of-the-box DNS logging for Kubernetes workloads. The DNS logs provide immediate visibility and insights into workload behavior, performance issues, and unauthorized access.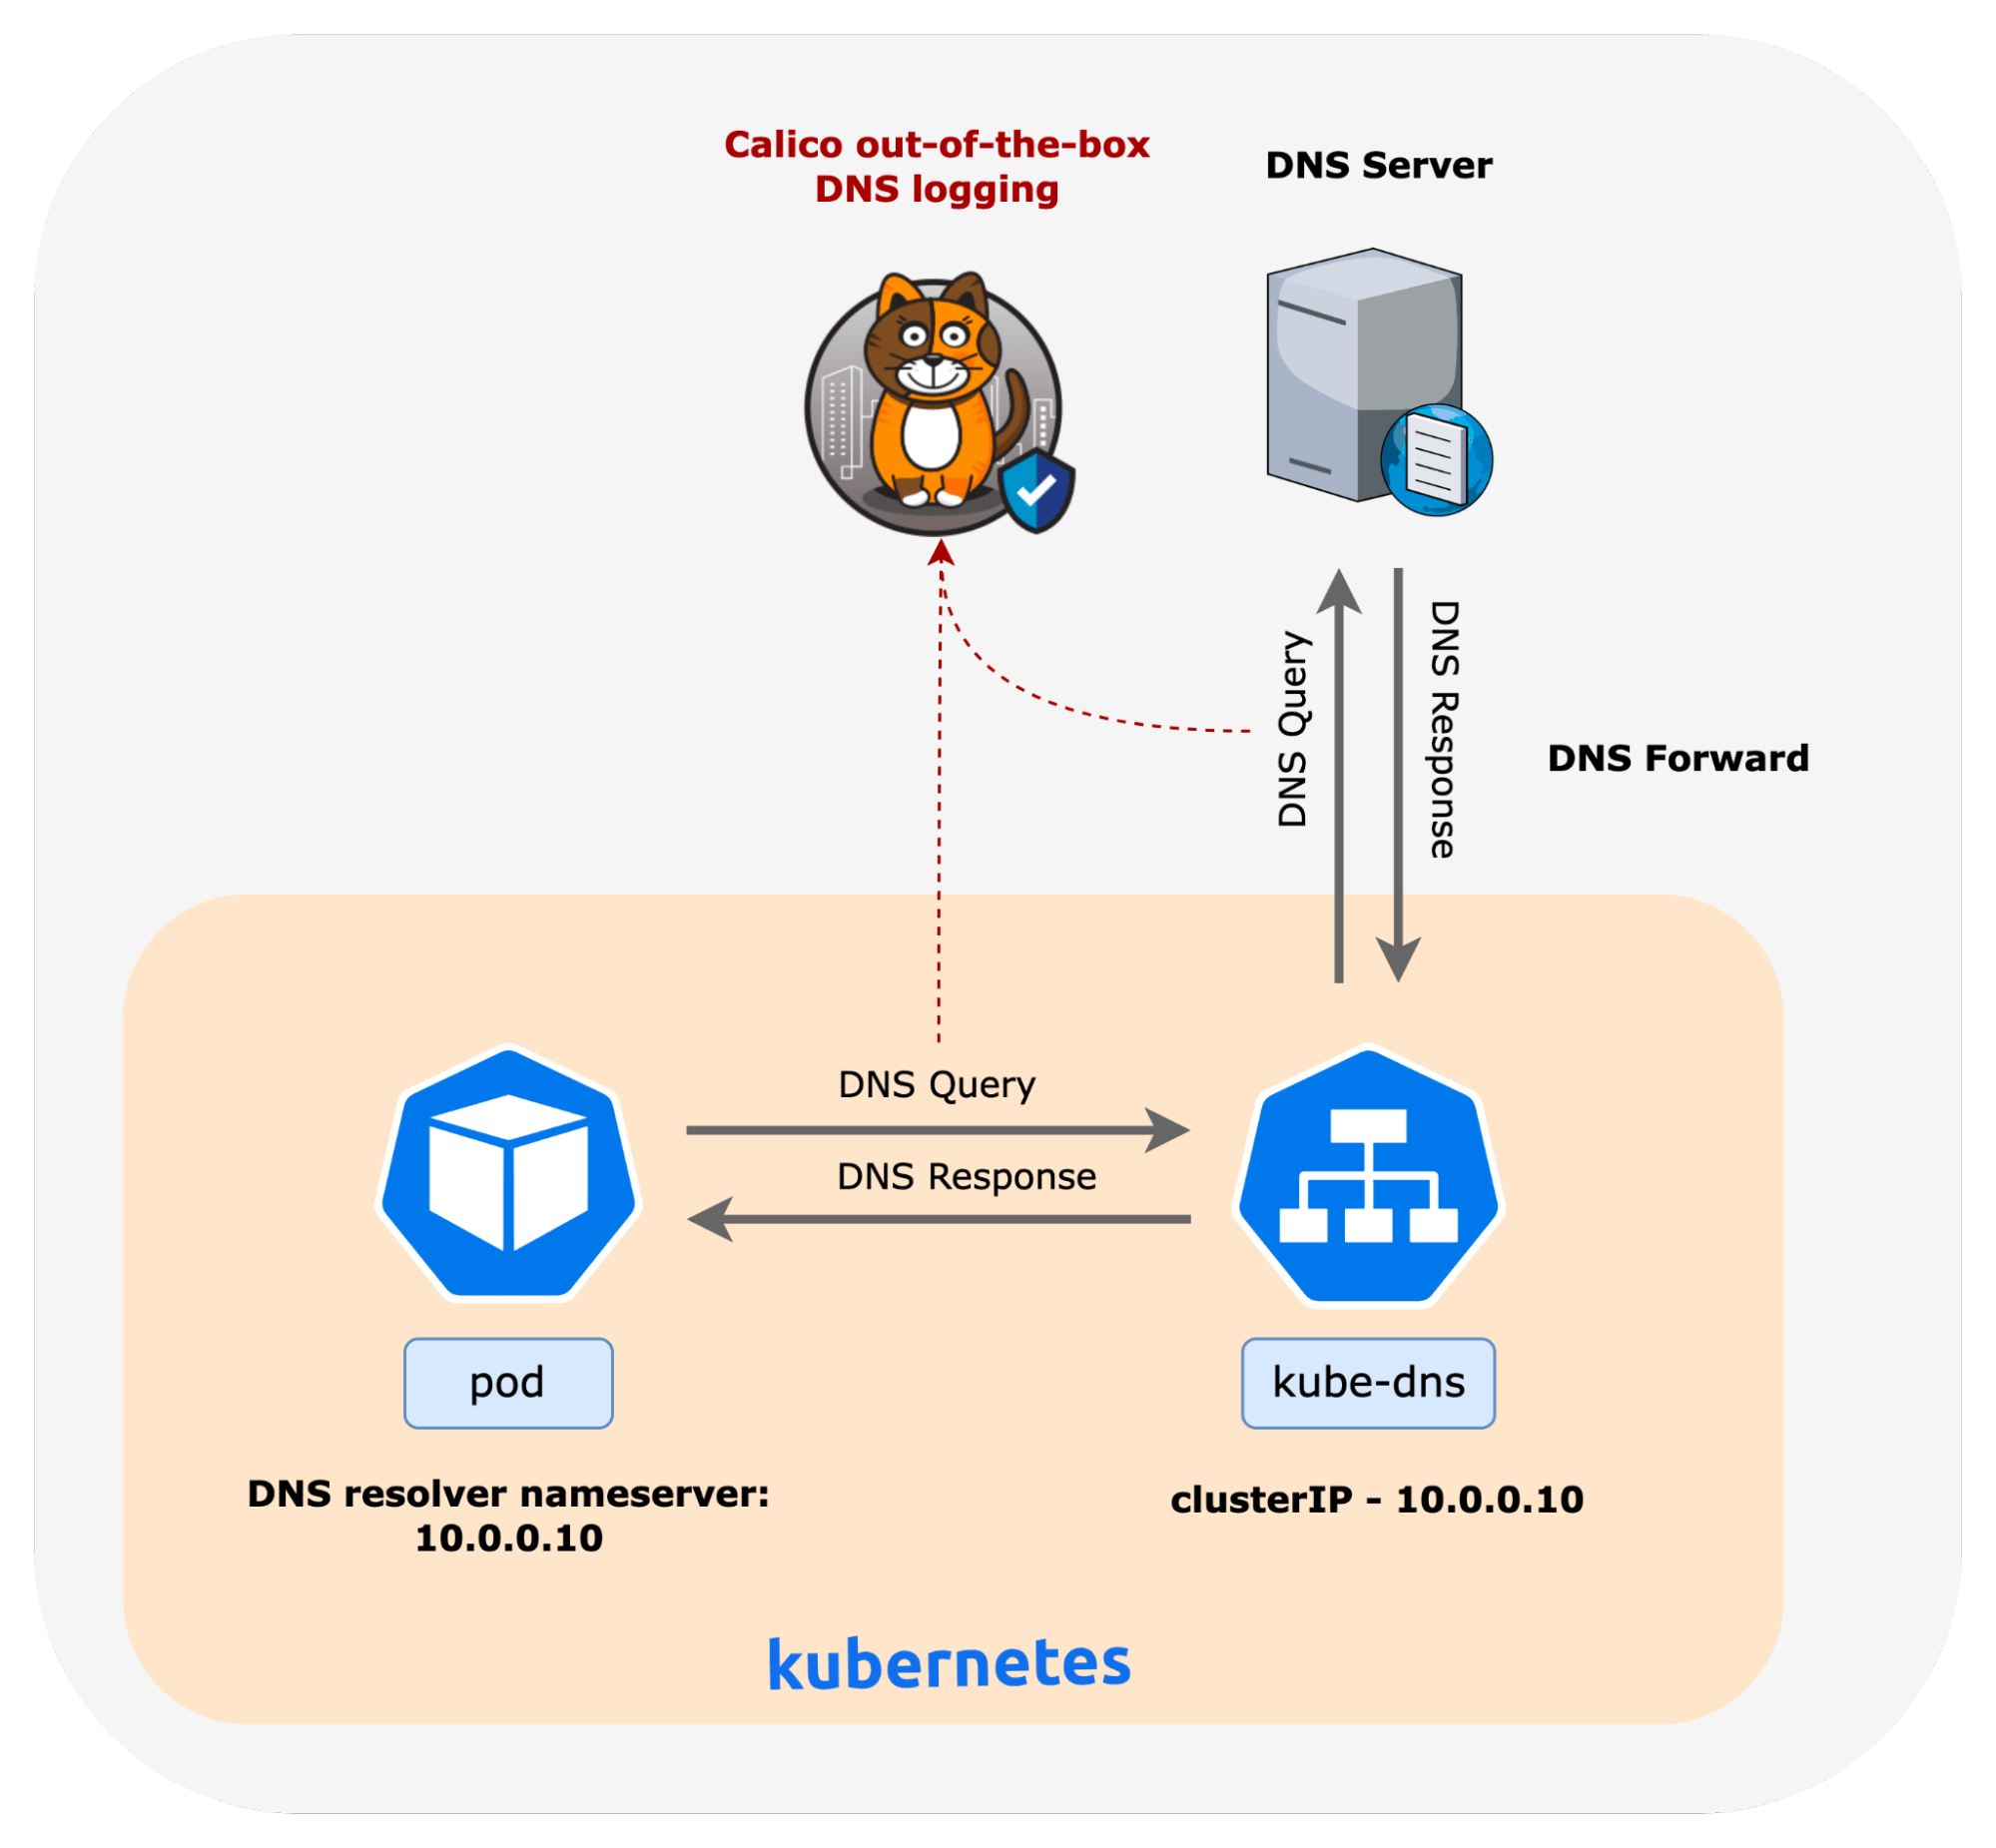
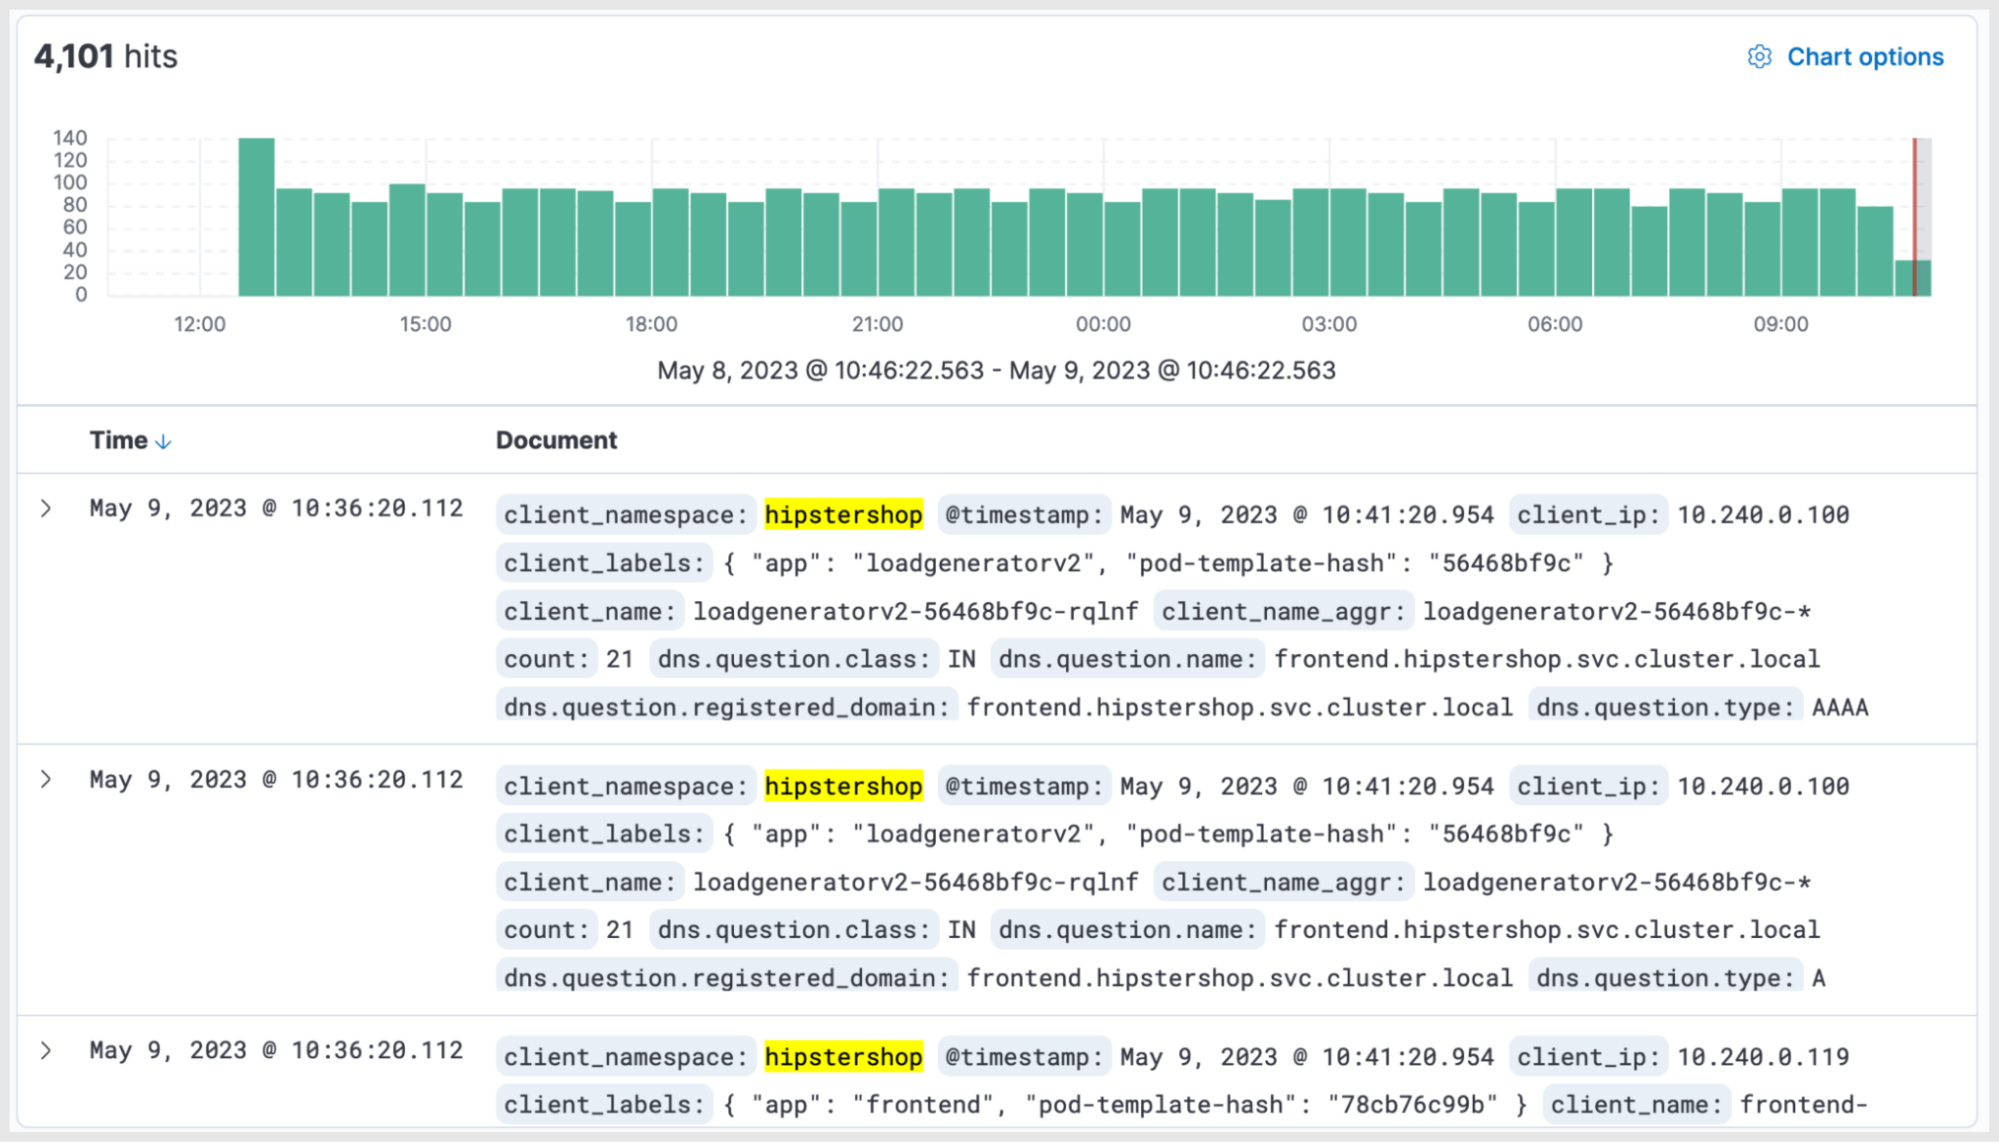
Users can access DNS logs in Kibana. Logs can be filtered using several parameters. For example, the image below shows the DNS logs for a sample application in a namespace called “hiptershop”.
Dynamic Service and Threat Graph
Gaining visibility into DNS flows is the first step toward understanding the potential DNS troubles in the cluster and individual workloads. The Service and Threat Graph extends this functionality by providing a graphical view to help identify connectivity to from other namespaces and workloads in the cluster. It also provides an interactive interface for users to identify specific DNS traffic flows and troubleshoot issues.
In the example image below, a user navigated to the kube-system namespace and selected the kube-dns service to retrieve DNS flow logs.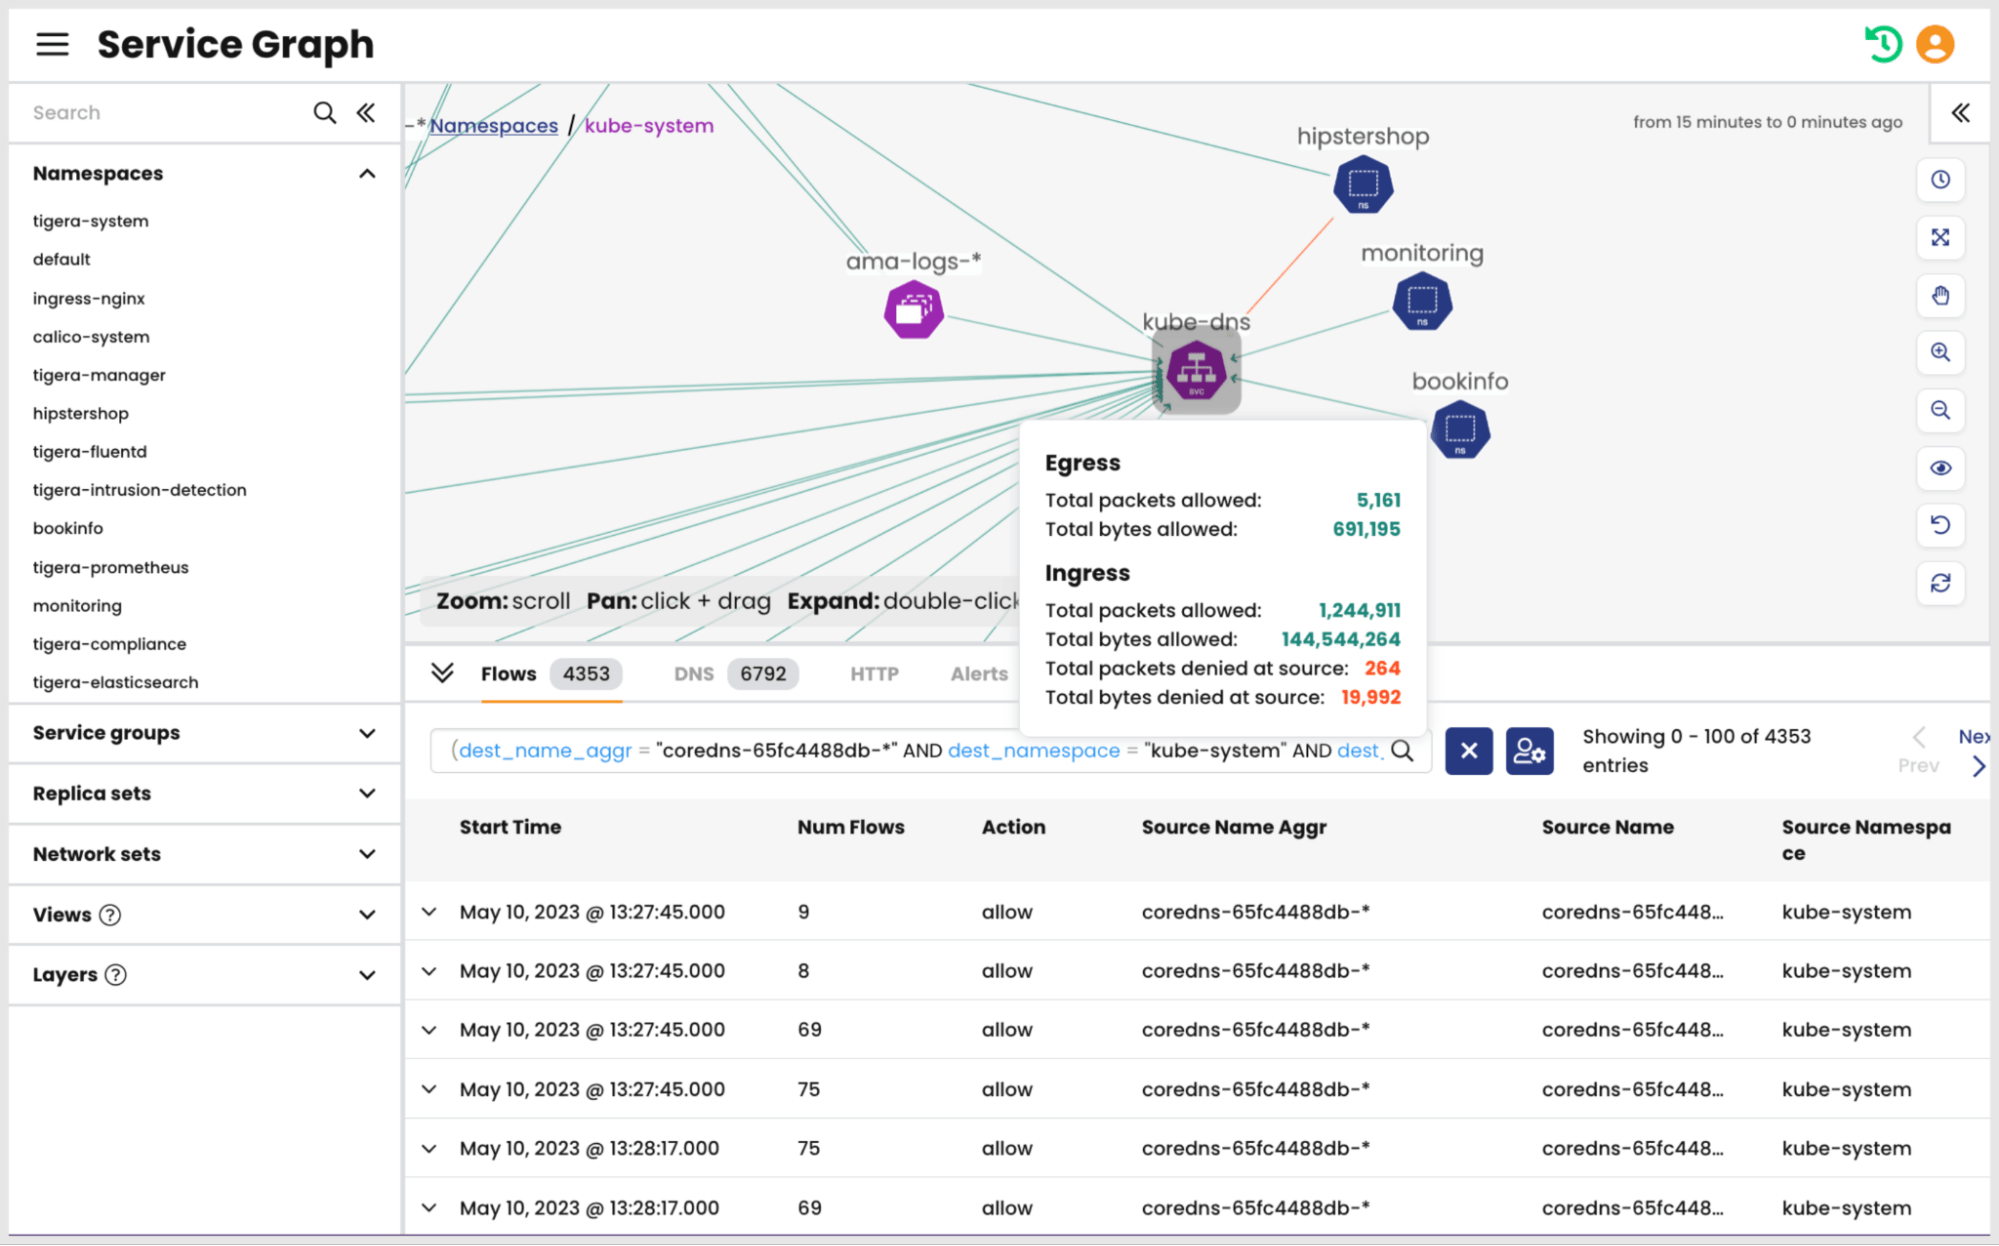
Once inside a namespace, the user can also select specific flows from other namespaces to retrieve flow logs to ensure that pods in those namespaces can send and receive DNS queries and responses.
In the image below, flow logs for DNS queries sent from the hipstershop namespace are visible in the bottom pane.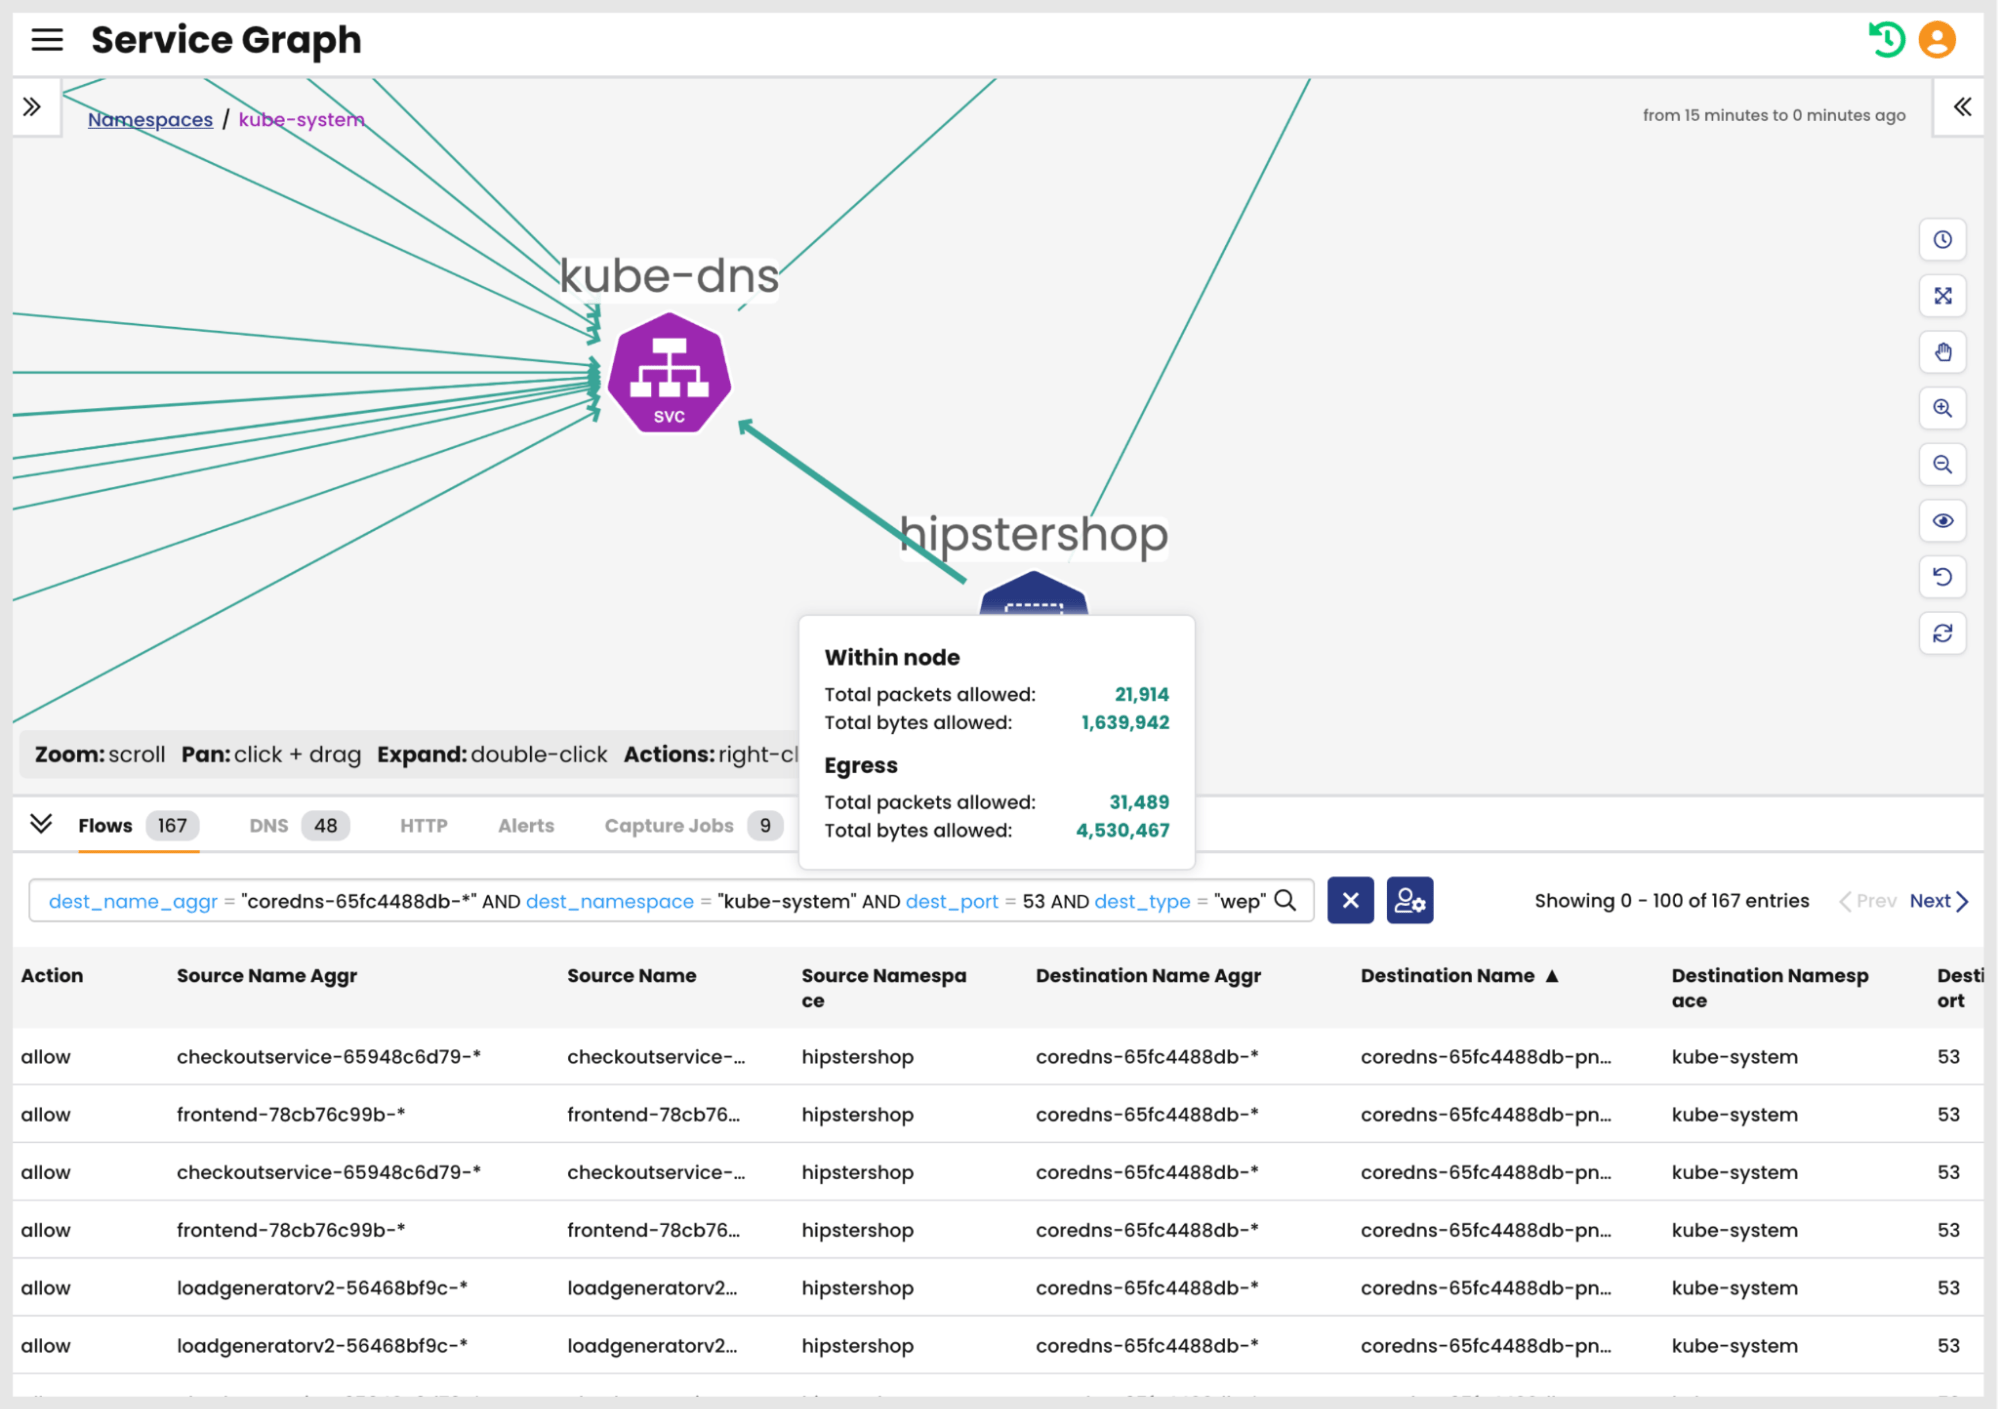
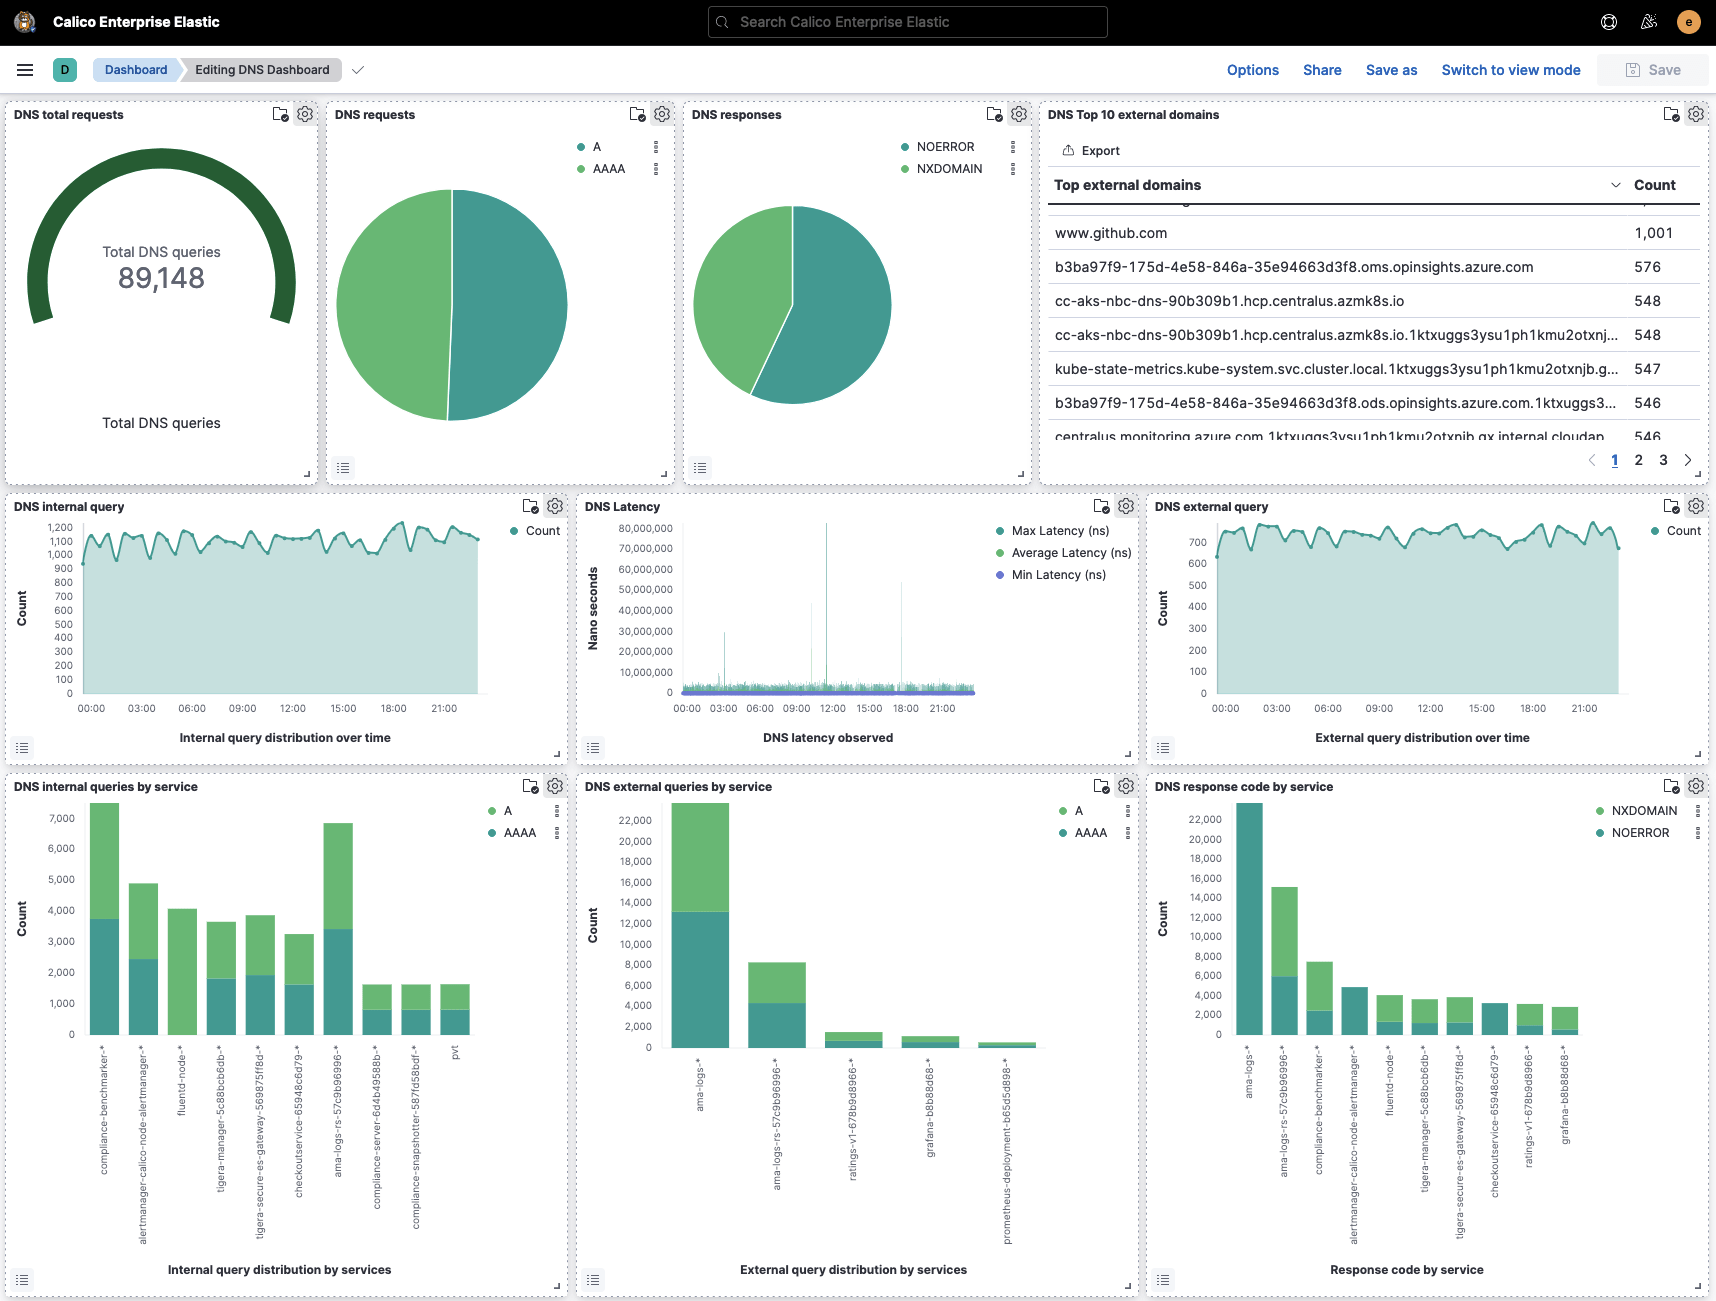
DNS Dashboard
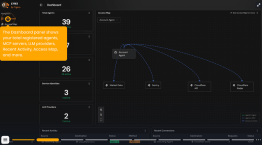
Calico offers an out-of-the-box DNS dashboard that provides an at-a-glance view of the cluster’s overall DNS statistics. The dashboard helps DevOps and application teams instantly spot DNS health and performance issues. Some of the analytics offered by the dashboard include:
- The types of DNS requests grouped by requested resource record
- DNS response codes to identify successful and erroneous DNS resolution attempts
- External domain resolution to identify connections to services outside the cluster
- The rate of DNS queries to identify DNS performance bottlenecks
- DNS response latency to help isolate application performance issues

DNS Troubleshooting Examples
In this section, we will review a few common DNS troubleshooting examples using Calico’s DNS observability features. These include:
- DNS traffic deny
- DNS “SERVFAIL” response code errors
- DNS “NXDOMAIN” response code errors
- DNS “NOERROR” with missing records
- “core-dns” load-balancing issues
DNS traffic deny
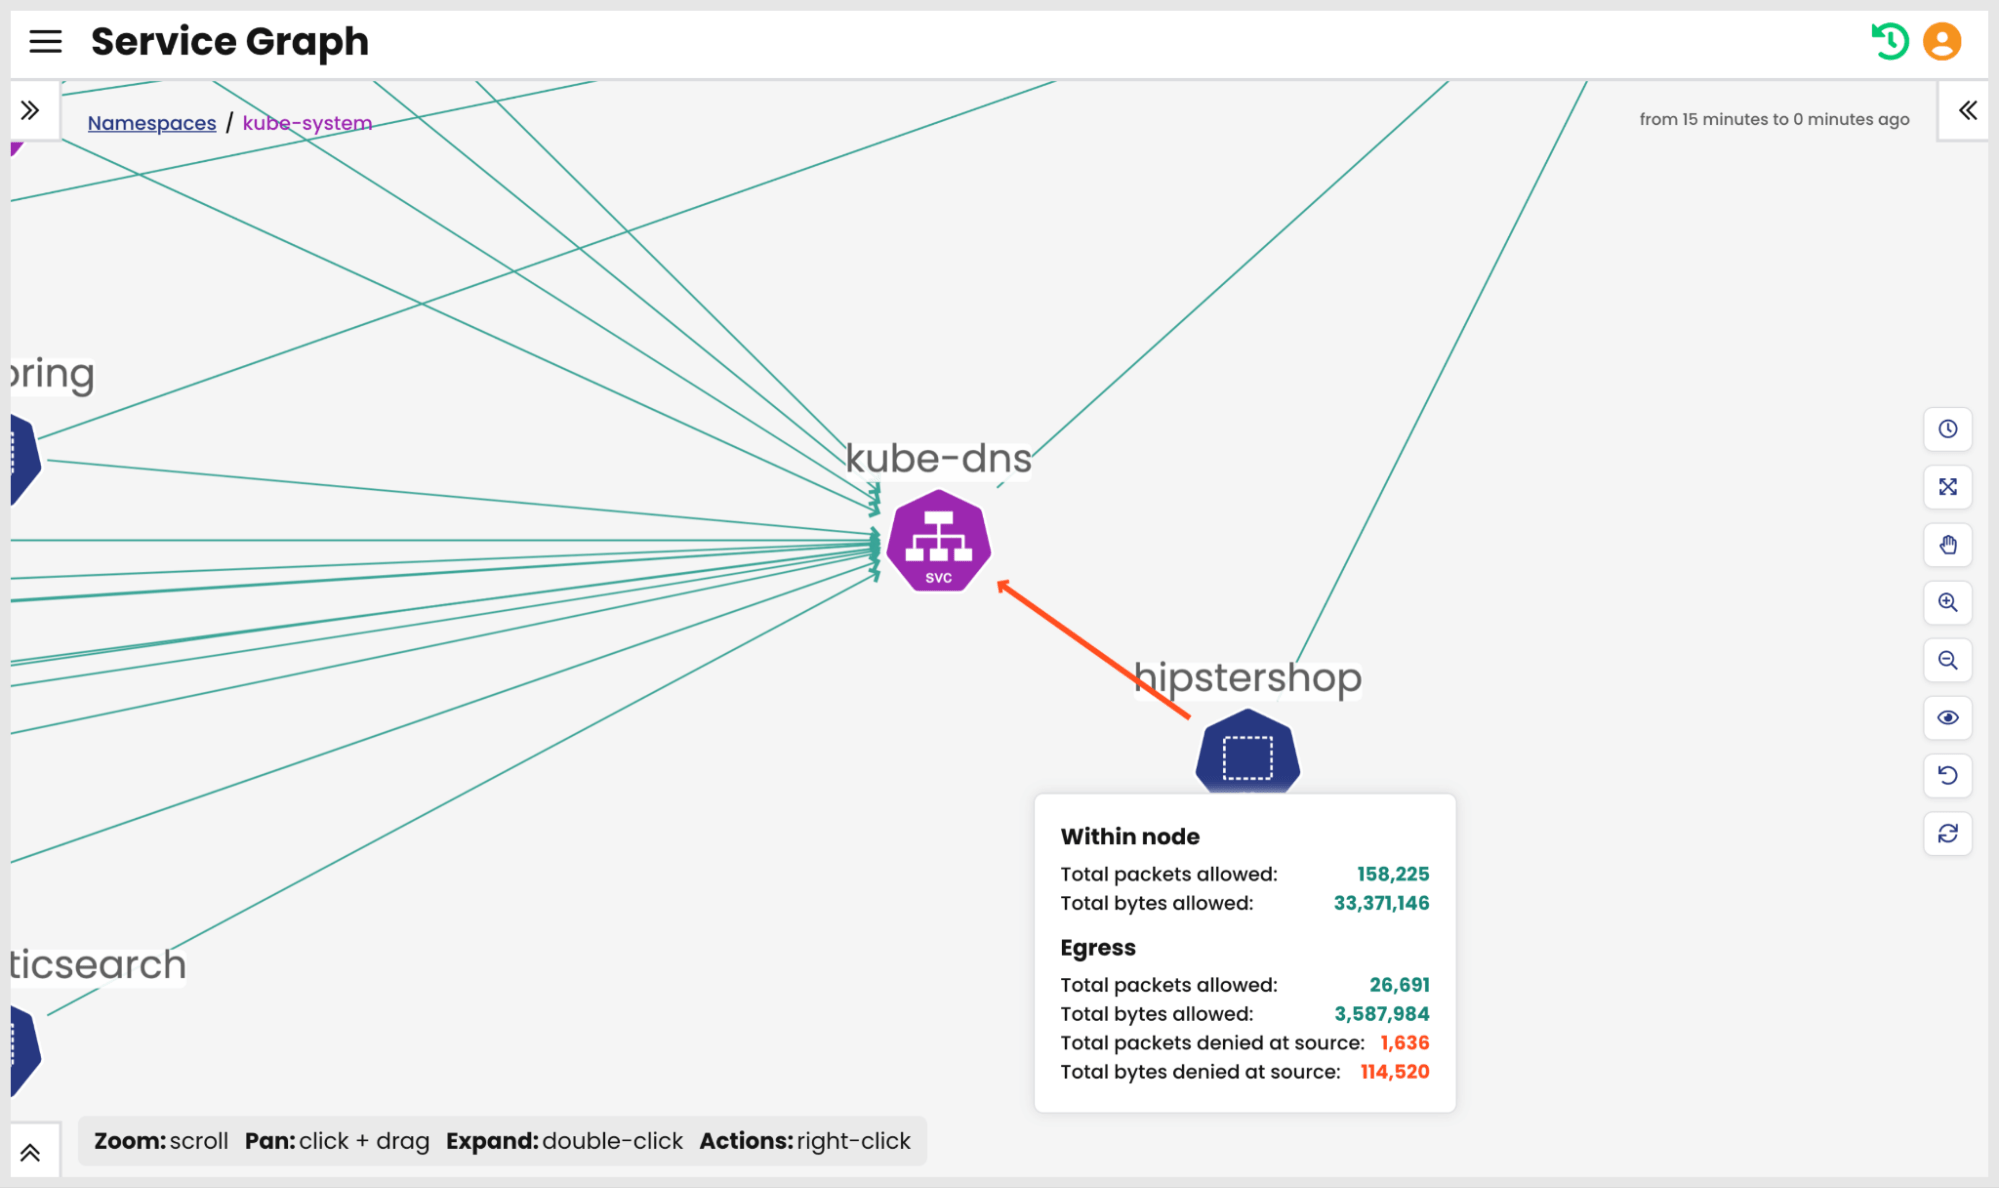
Misconfigured security policies can prevent workloads from performing domain name lookups. Since pod IPs are ephemeral in Kubernetes, a workload will not be able to discover other services in the cluster if it’s unable to communicate with kube-dns. The Service and Threat Graph highlights denied traffic which can help DevOps teams identify the issue immediately. The image below shows an example of security policies denying traffic to kube-dns from the “hipstershop” namespace. The Service and Threat Graph helps identify the policy blocking traffic, significantly reducing the time it takes to troubleshoot misconfigured security policies.
DNS “SERVFAIL” response code errors
DNS SERVFAIL errors could occur when DNS forward servers configured in core-dns fail to respond to DNS queries. Enterprises typically forward external domain lookups to designated nameservers to improve network performance and security. Pods in the Kubernetes cluster will not be able to resolve external domains if those DNS servers fail or are not configured correctly. Further, a misconfiguration in the core-dns configmap for DNS forwarding could also result in core-dns forwarding DNS queries to invalid DNS servers; this could typically happen when DNS servers are decommissioned or due to changes in an organization’s infrastructure.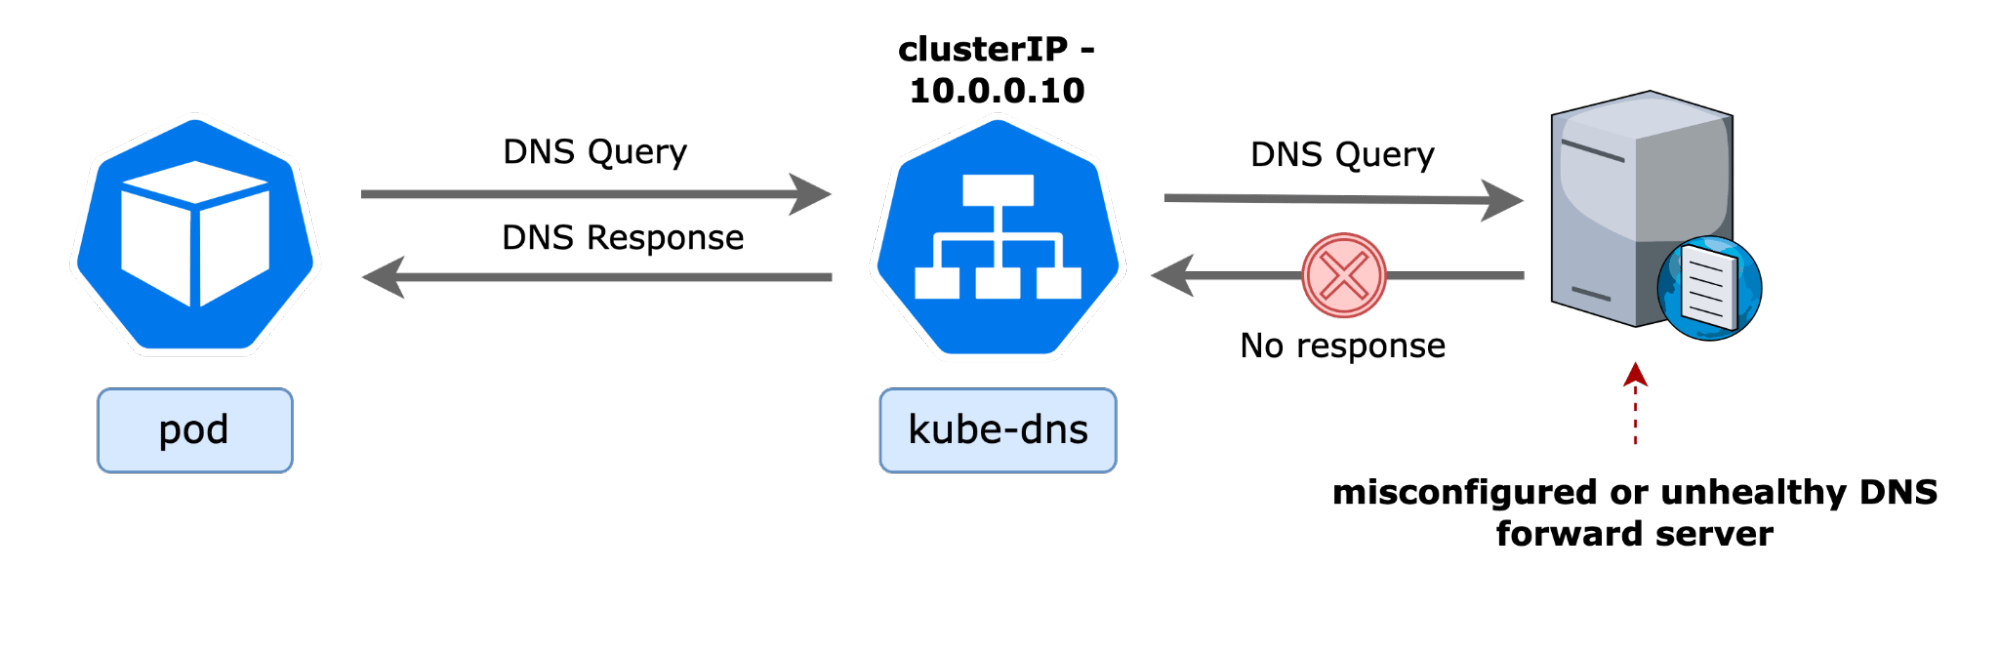
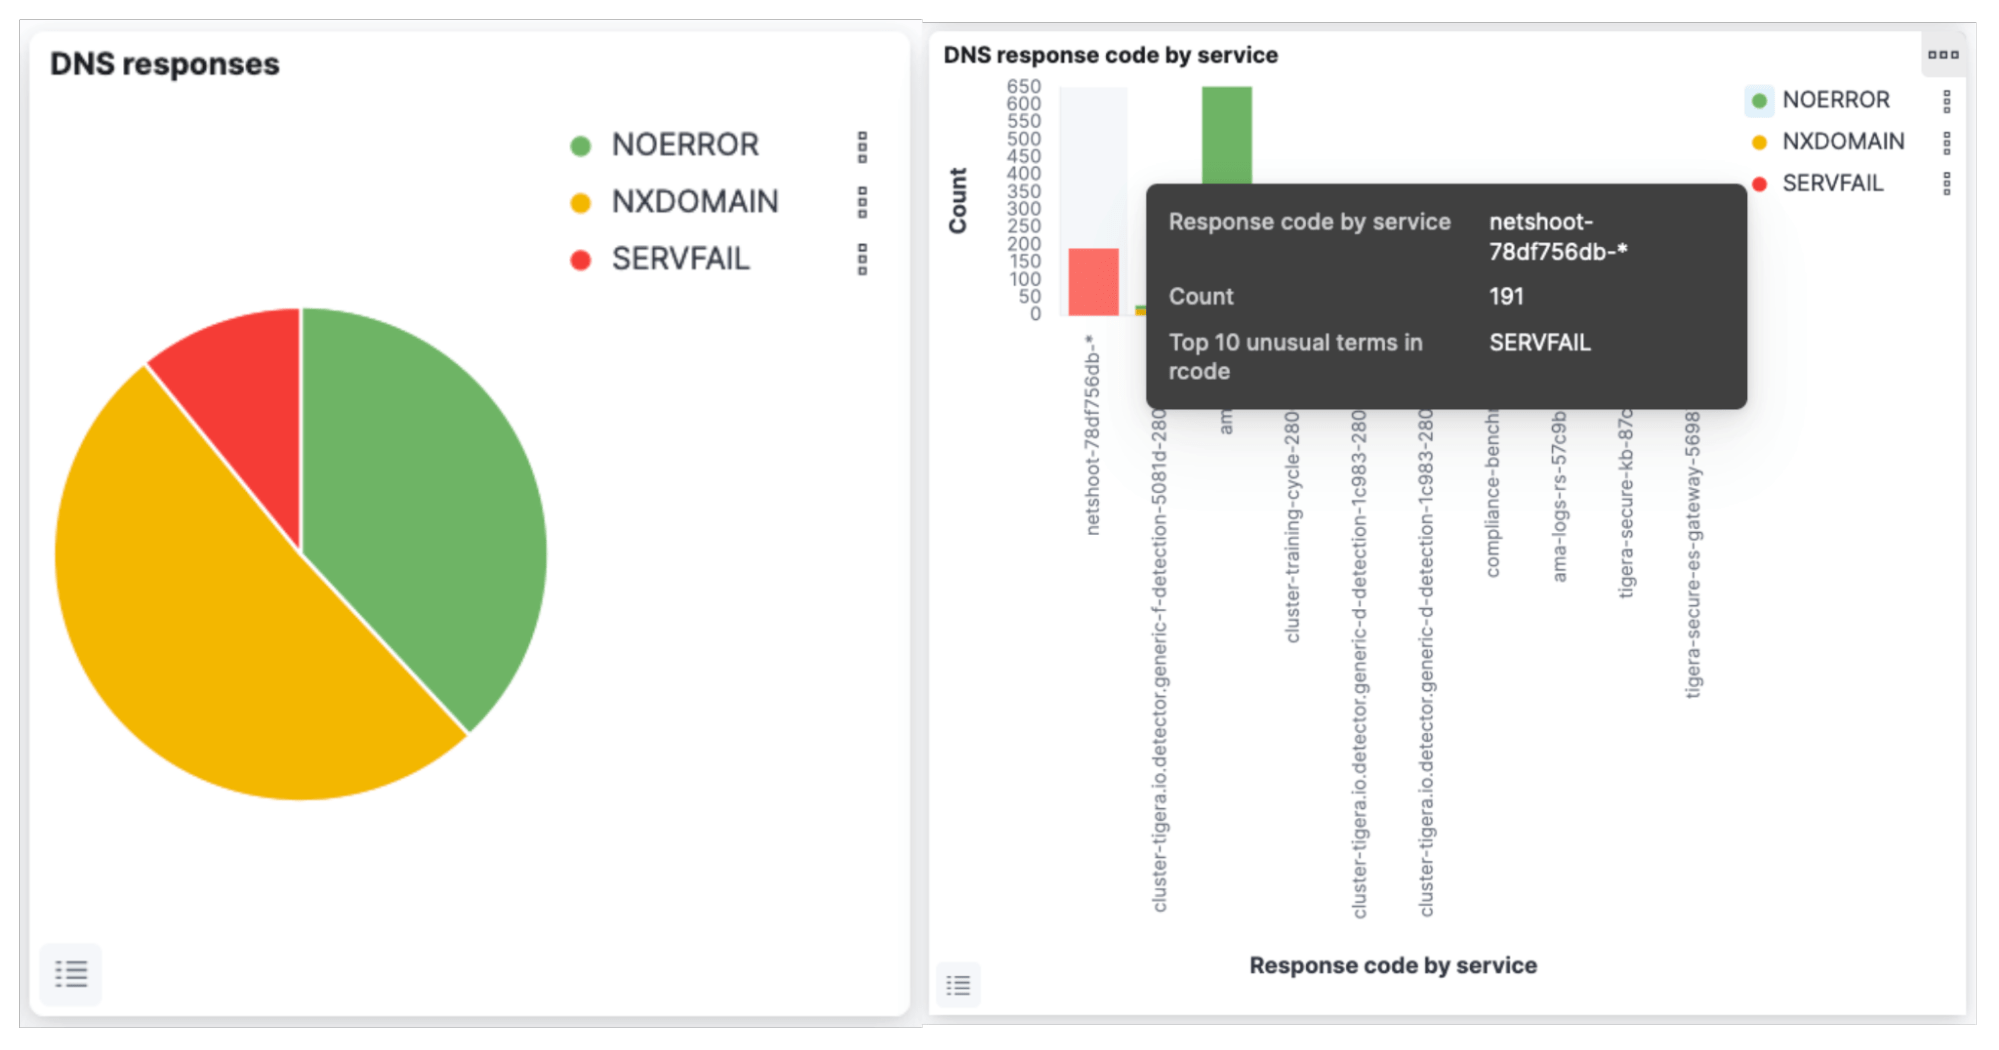
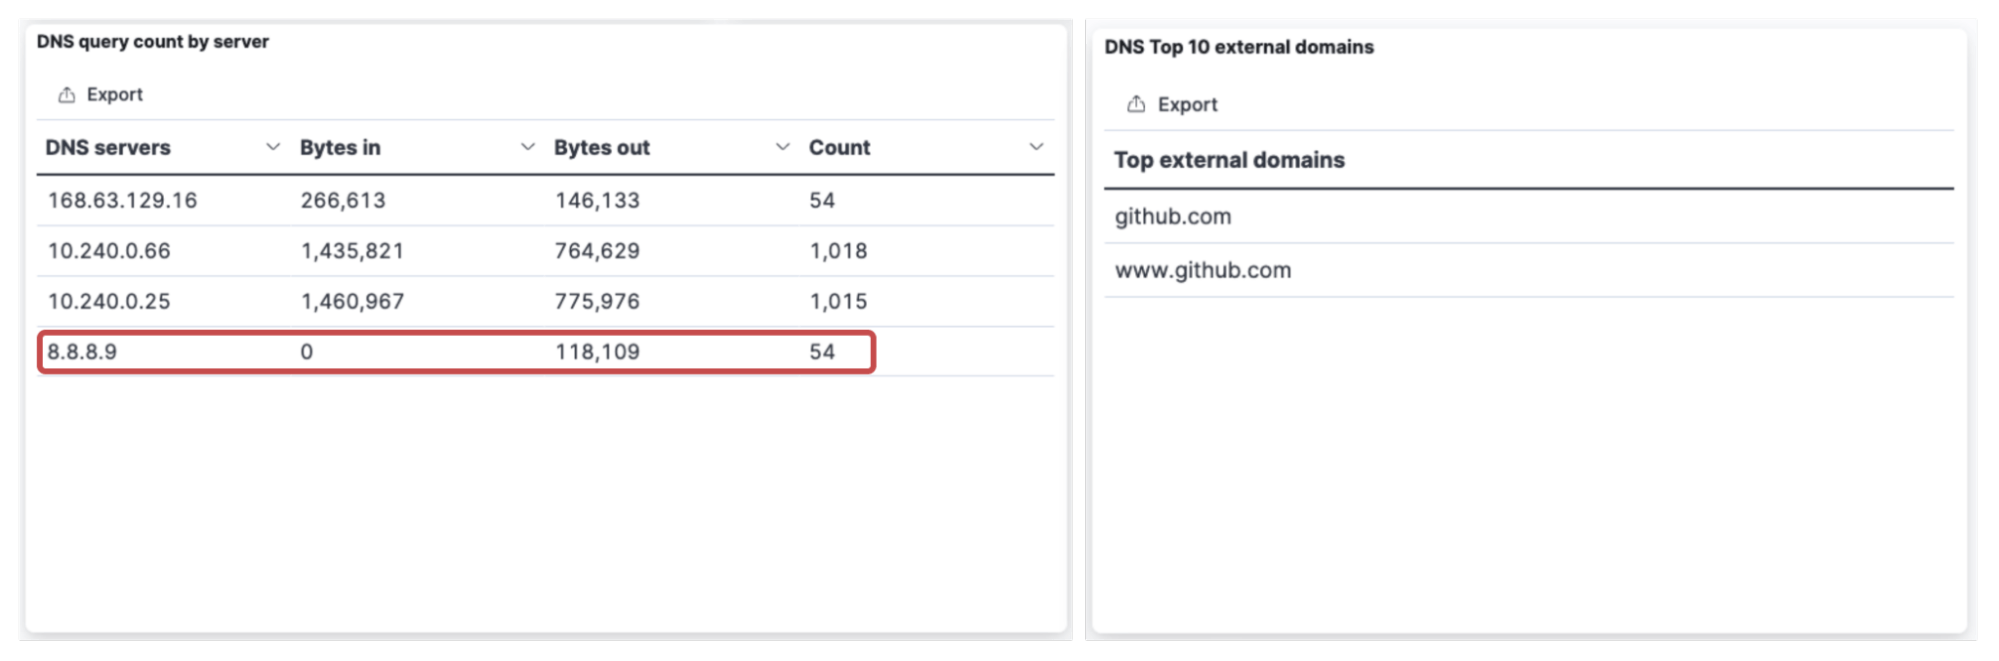
Calico’s DNS dashboard can instantly highlight “SERVFAIL” errors and help DevOps engineers rapidly isolate the issue. The image below shows an example of how DNS “SERVFAIL” errors are impacting a “netshoot” pod trying to communicate with “github.com”. It can also be seen that “8.8.8.9” is used as a DNS server with 0 “bytes_in”, indicating that the server is not responding to DNS queries. This indicates a misconfiguration in the “core-dns” configmap for DNS forwarding.
kubectl get configmap coredns-custom -n kube-system -o yaml
apiVersion: v1
data:
  test.server: |
    github.com:53 {
        forward . 8.8.8.9
    }
DNS “NXDOMAIN” response code errors
DNS “NXDOMAIN” responses indicate that there is no resource record of any type for the queried domain name. Such issues can occur when a domain is decommissioned or changed, but Kubernetes workloads continue to send DNS queries for it. Similarly, NXDOMAIN errors could also occur when a pod in the cluster sends DNS queries for a service name that does not exist in the cluster. Similar to the previous example, it’s possible to use the DNS dashboard to identify the issue; however, for this example, let’s look at how packet captures can be used. Users have the option of initiating a packet capture for a given service from the Service and Threat Graph. In the example below, the kube-dns service is selected to initiate a packet capture, and a filter for UDP 53 is applied to the capture.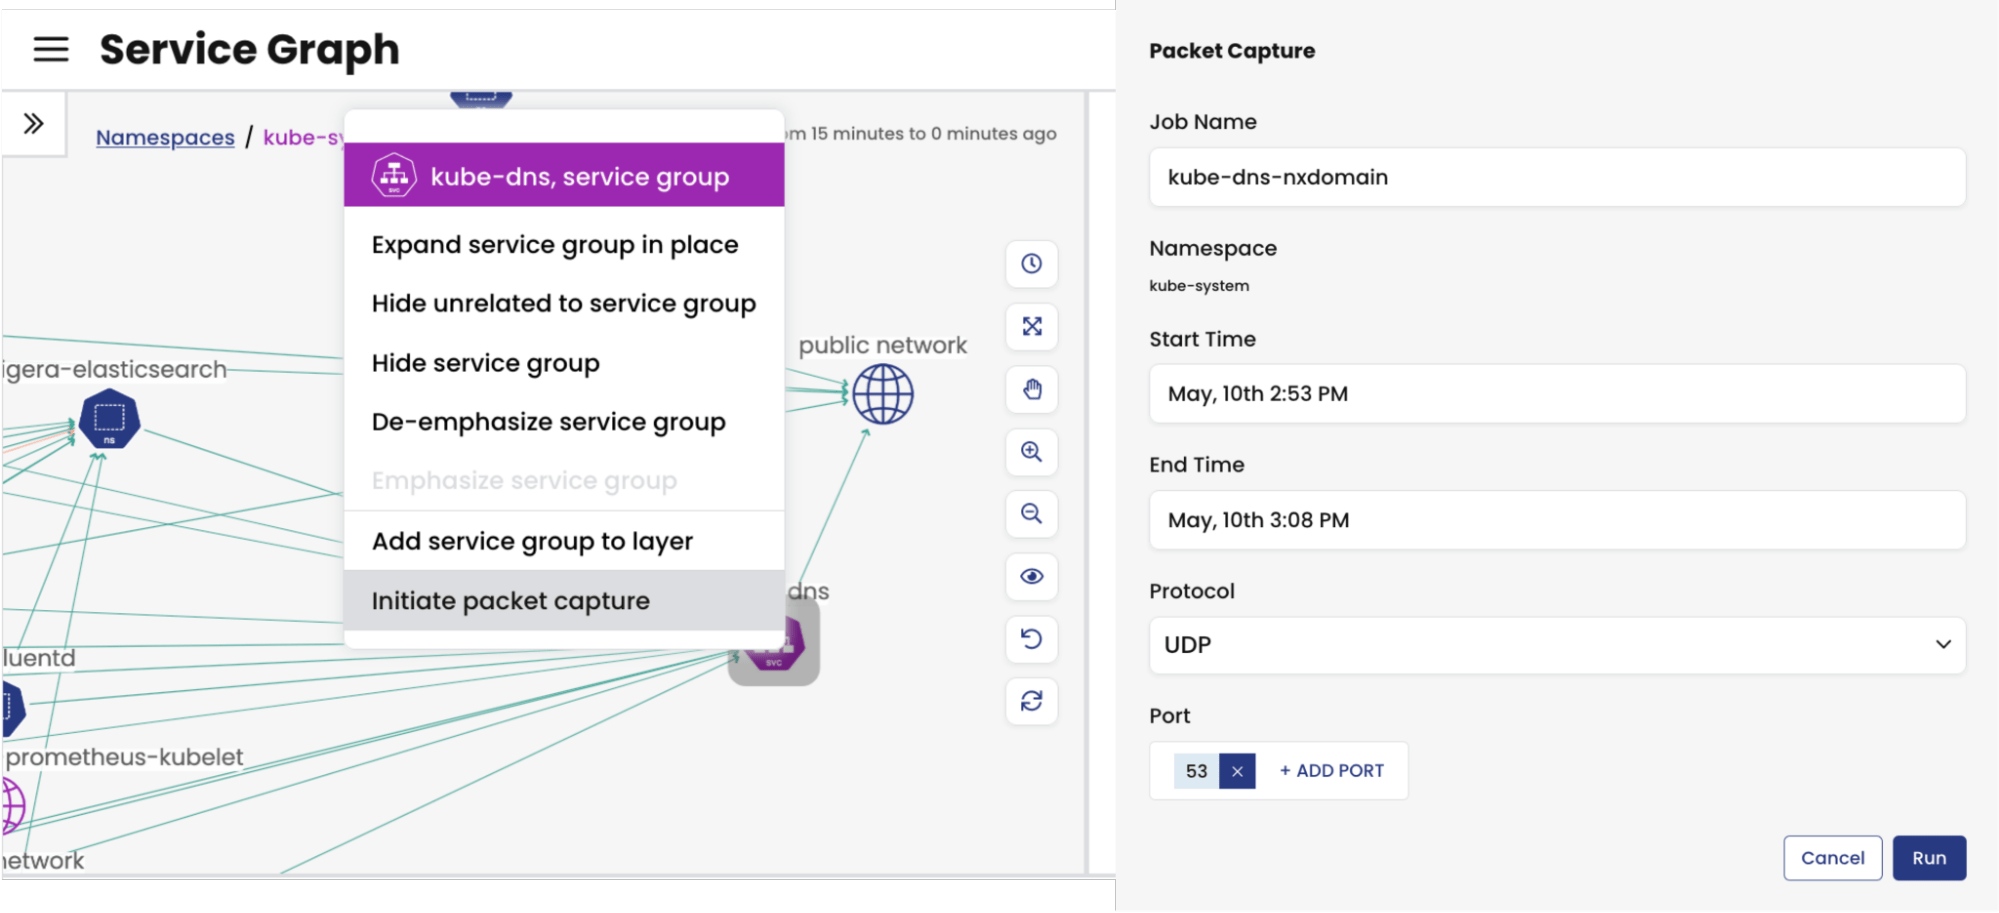
Once complete, the capture can be downloaded and analyzed using a packet analyzer like Wireshark. Packets with “NXDOMAIN” response code can be filtered using dns.flags.rcode == 3 flag. The image below shows an “NXDOMAIN” response for the query “dnsnxdomain.lynx.tigera.ca”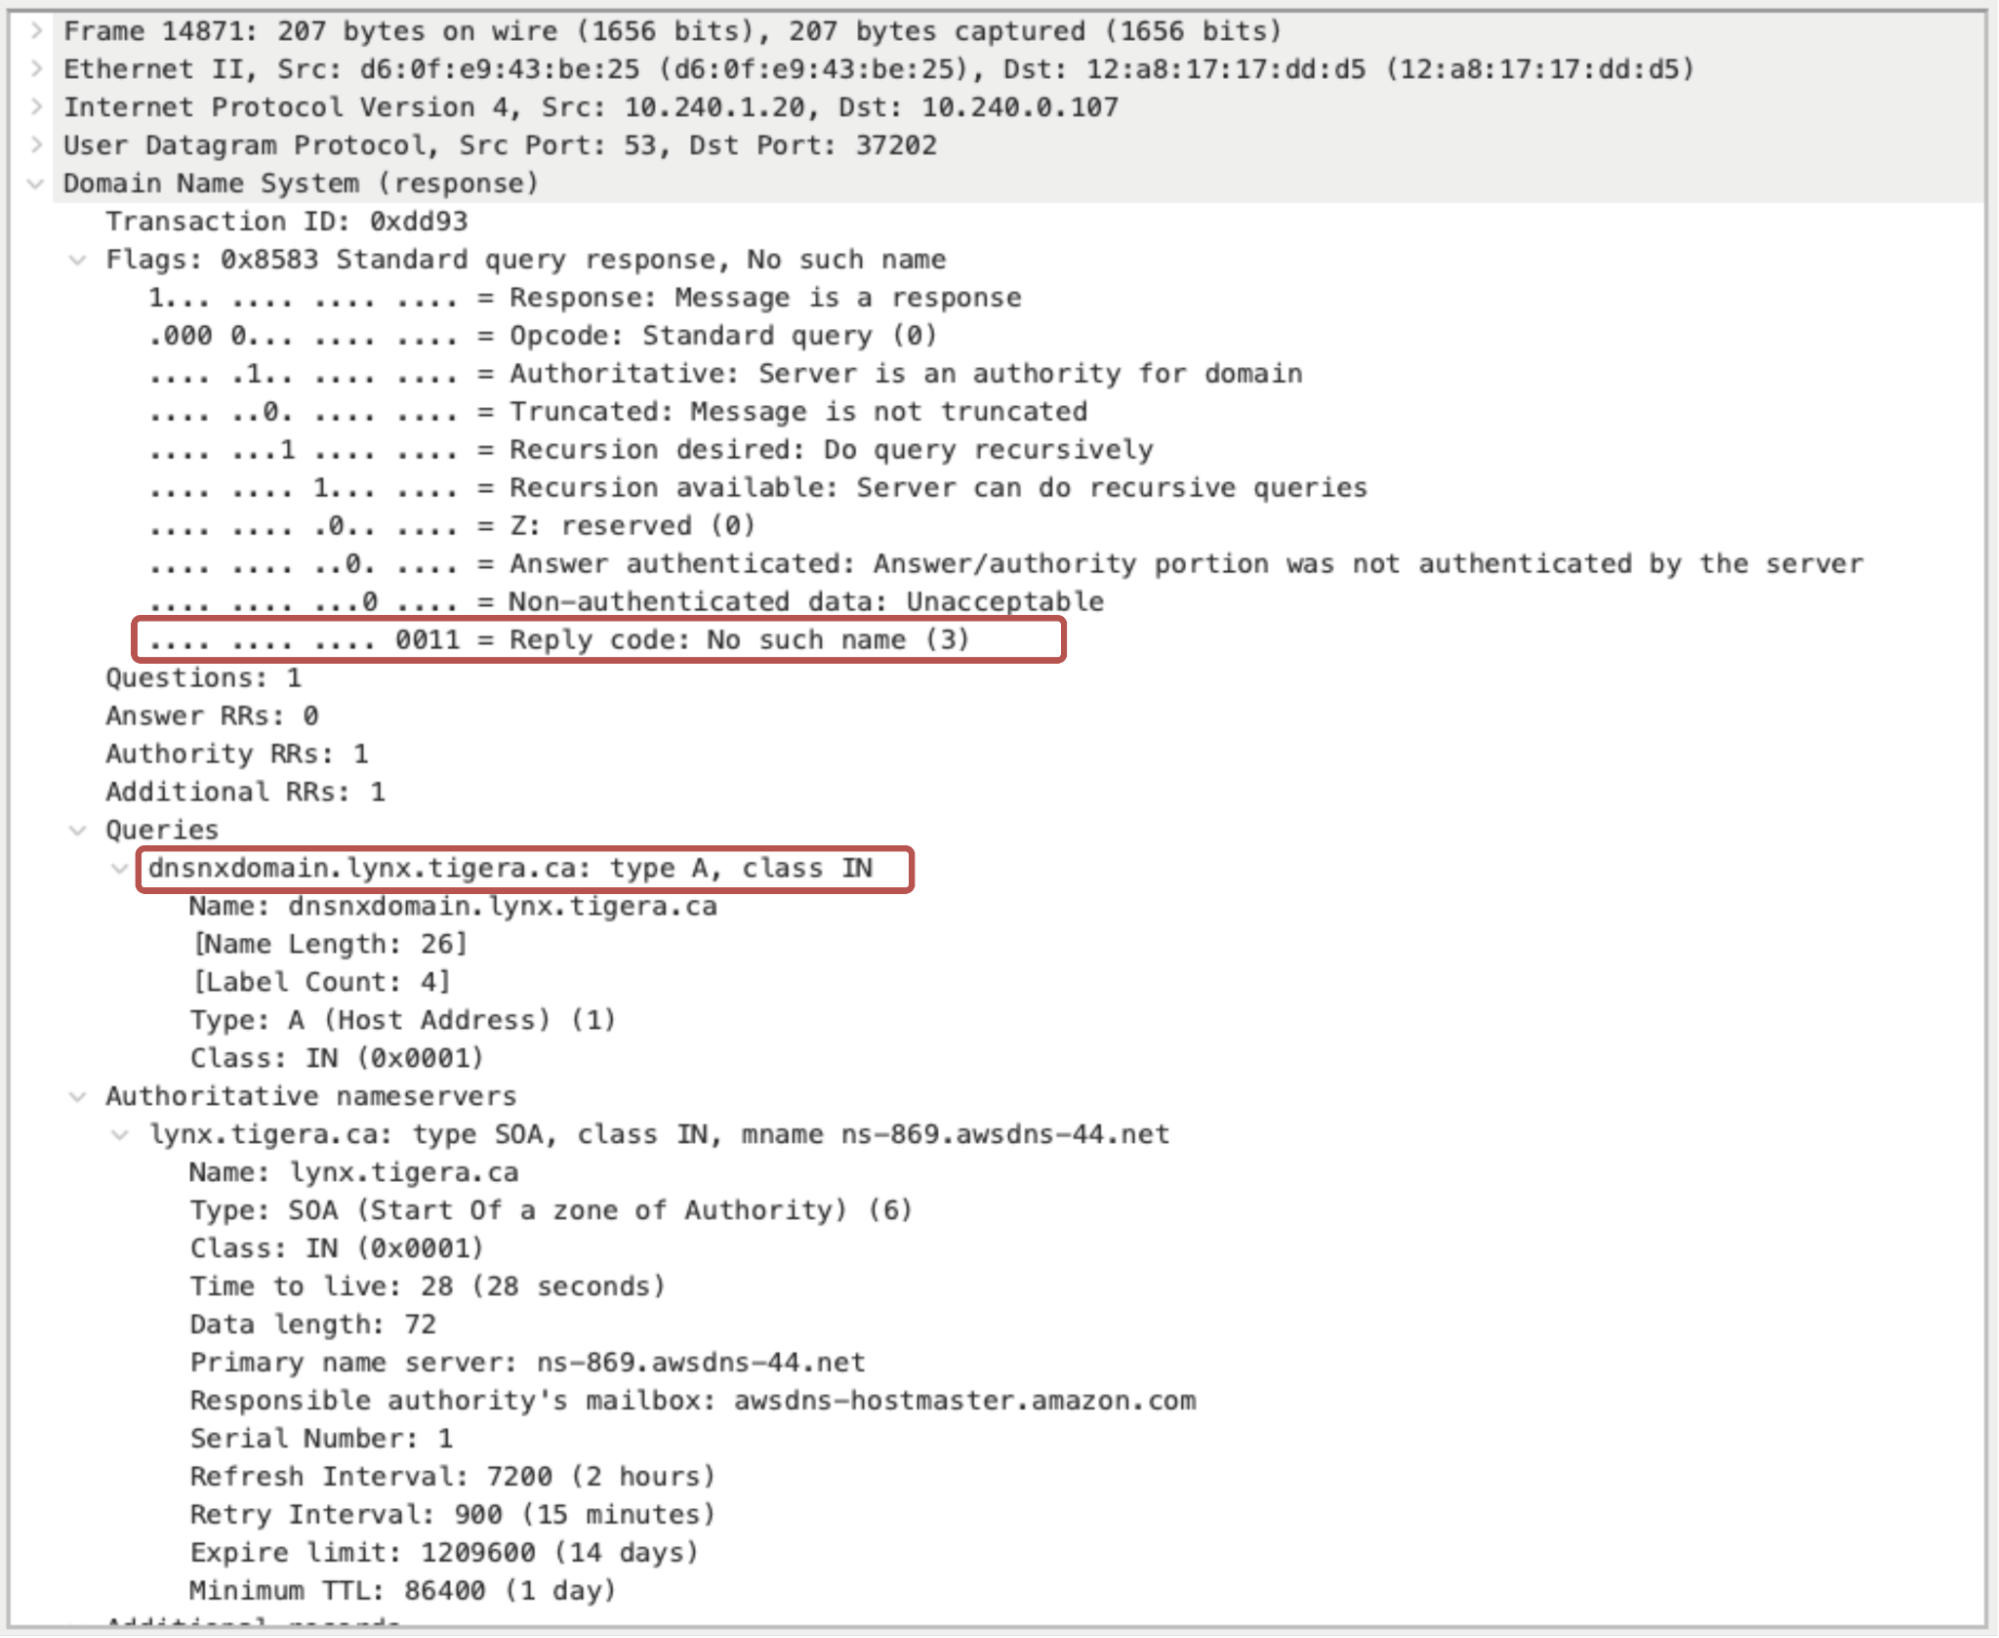
The diagram below shows an example of how the above domain name lookup was performed from a Kubernetes cluster and the points at which Calico gathered the packets. Packet captures can be triggered from any namespace, pod, or service in the cluster and provides “in the wire” visibility into DNS packets. 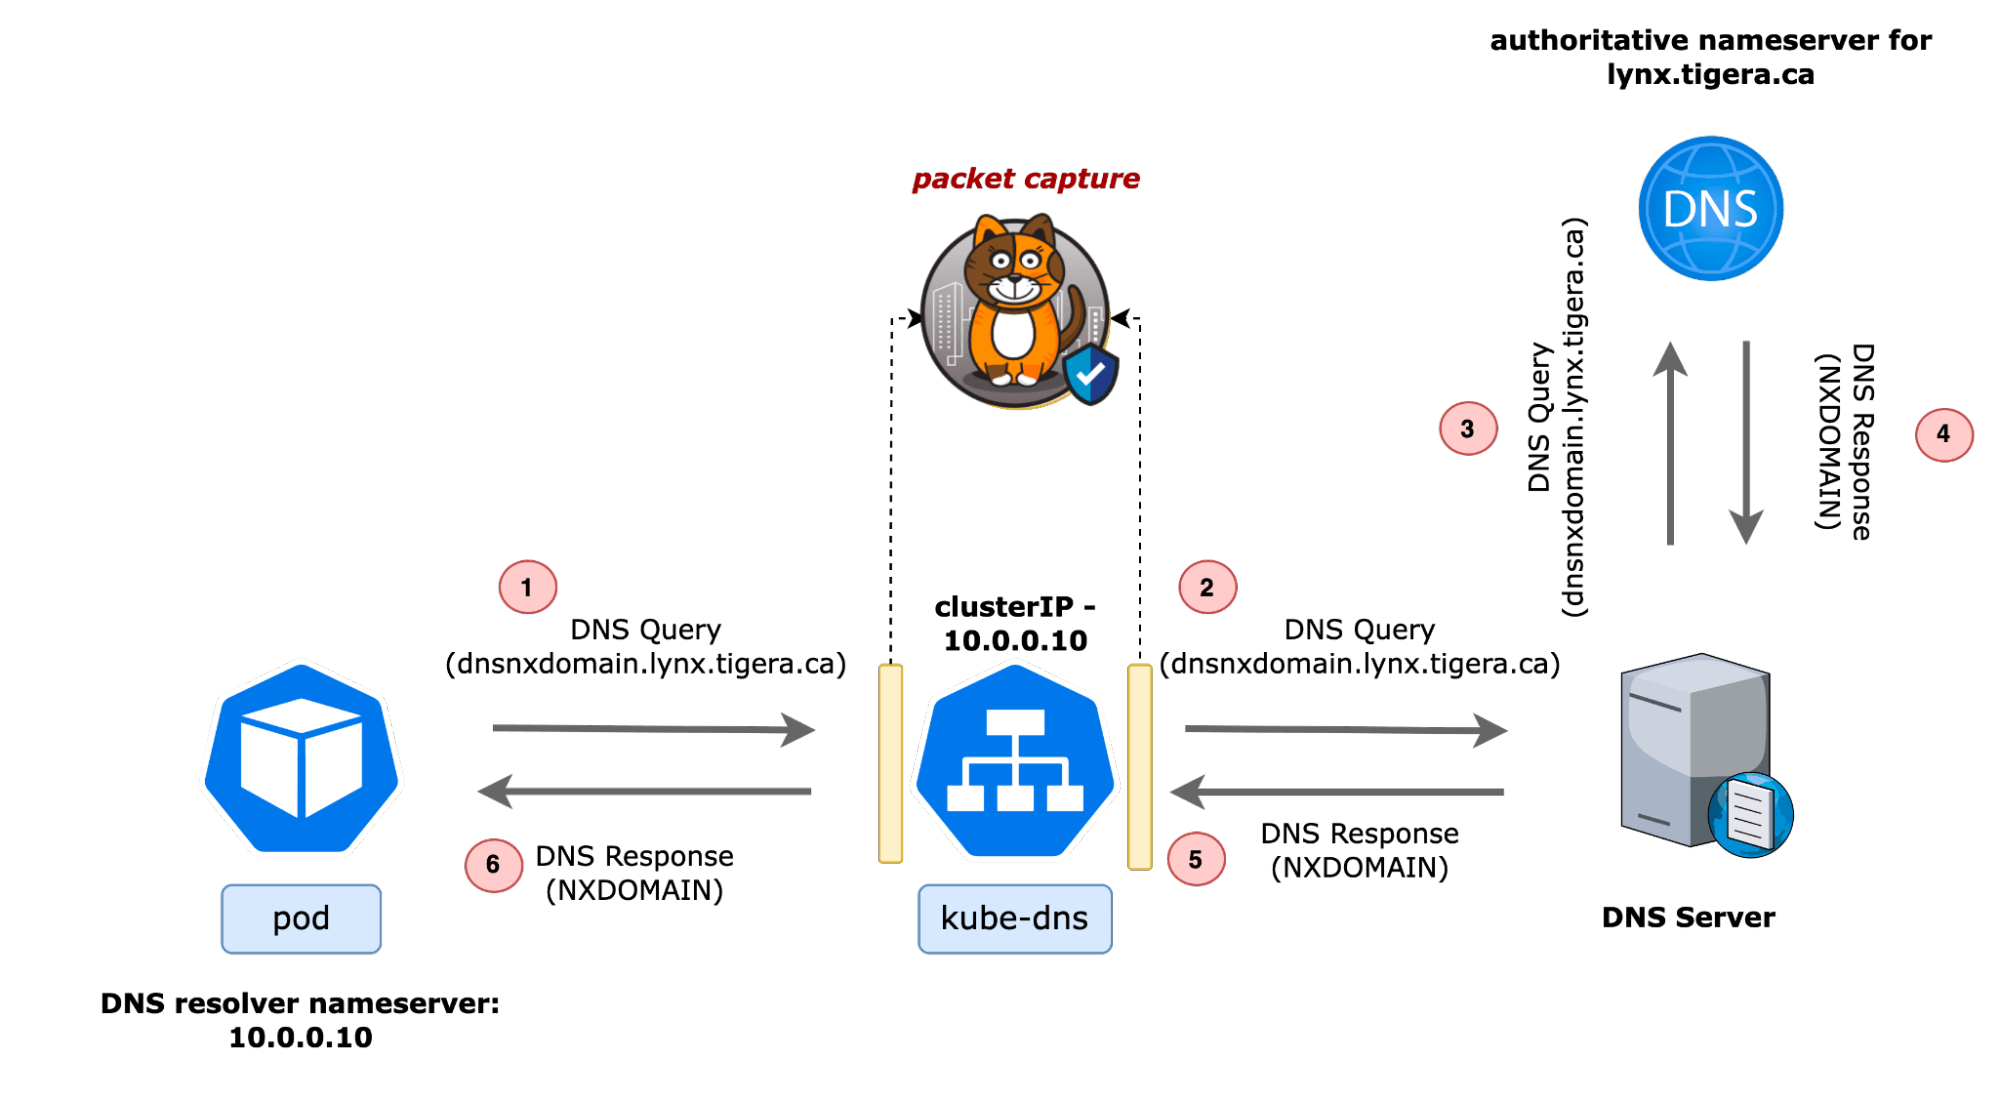
DNS “NOERROR” with missing records
A DNS “NOERROR” response code indicates that the DNS query was completed successfully and that the client received a valid response from the DNS server. This doesn’t, however, mean that the client received a response for the requested DNS question type. A valid response with missing resource records can lead to application communication issues that are difficult to identify. These issues could also be sporadic, causing intermittent failures that could take DevOps and application teams days to resolve.
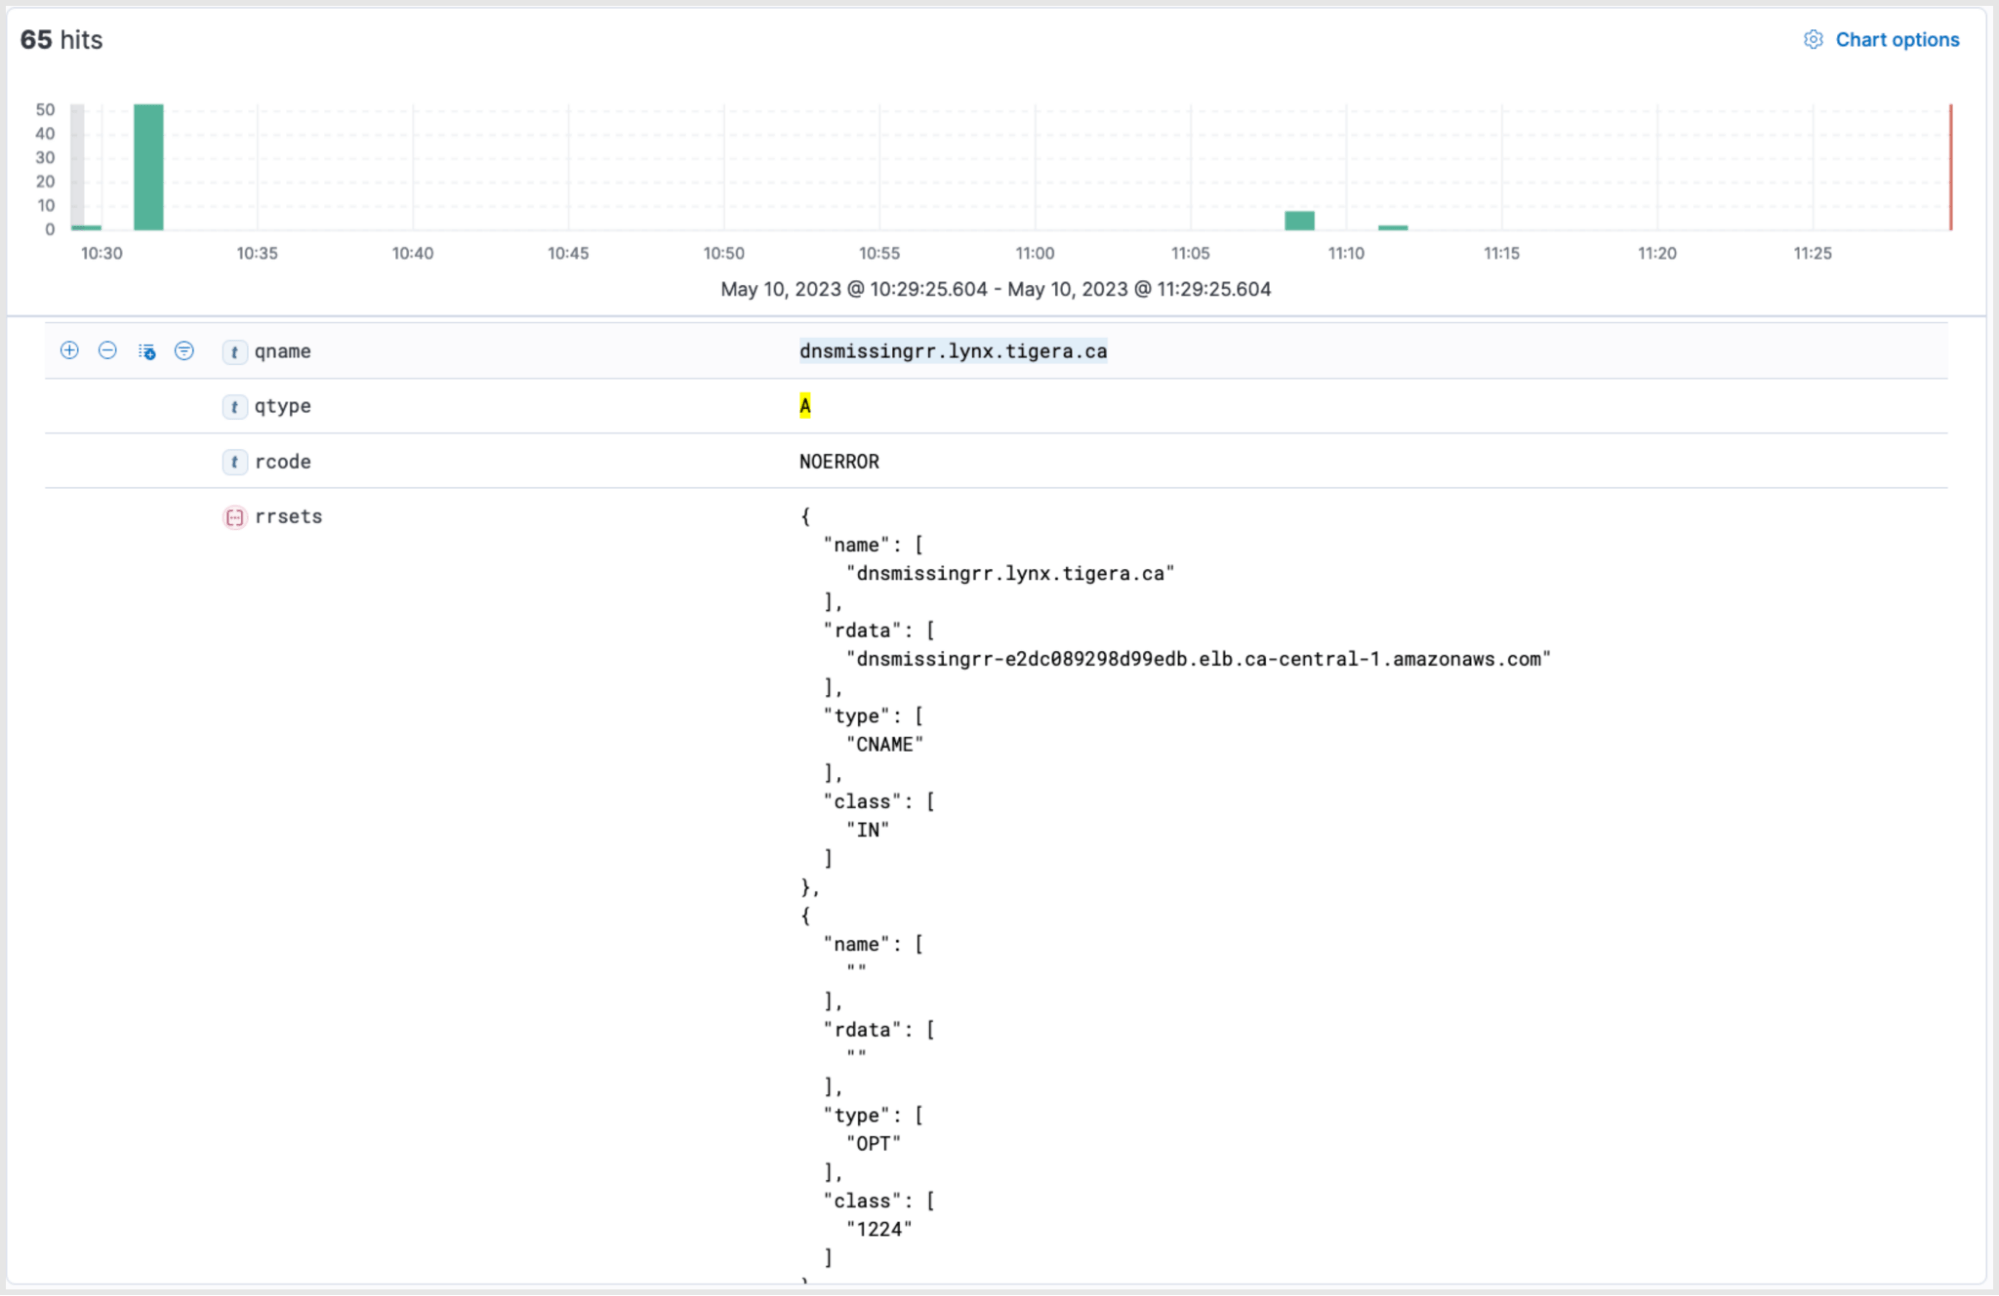
Let’s look at an example of a DNS query type “A” from a pod that receives a response with code “NOERROR” and a CNAME record but does not include the requested A record. The query to filter such DNS responses in Calico’s Kibana dashboard is given below.
dns.question.type: A and rrsets:{ type : "CNAME" } AND NOT (rrsets:{ type : "A" })
The results indicate intermitted DNS responses with “NOERROR” but missing resource records to DNS name “dnsmissingrr.lynx.tigera.ca”. The DNS response has returned a resource type “CNAME” but has not returned an “A” record. In such instances, the application will not be able to communicate with the required services.
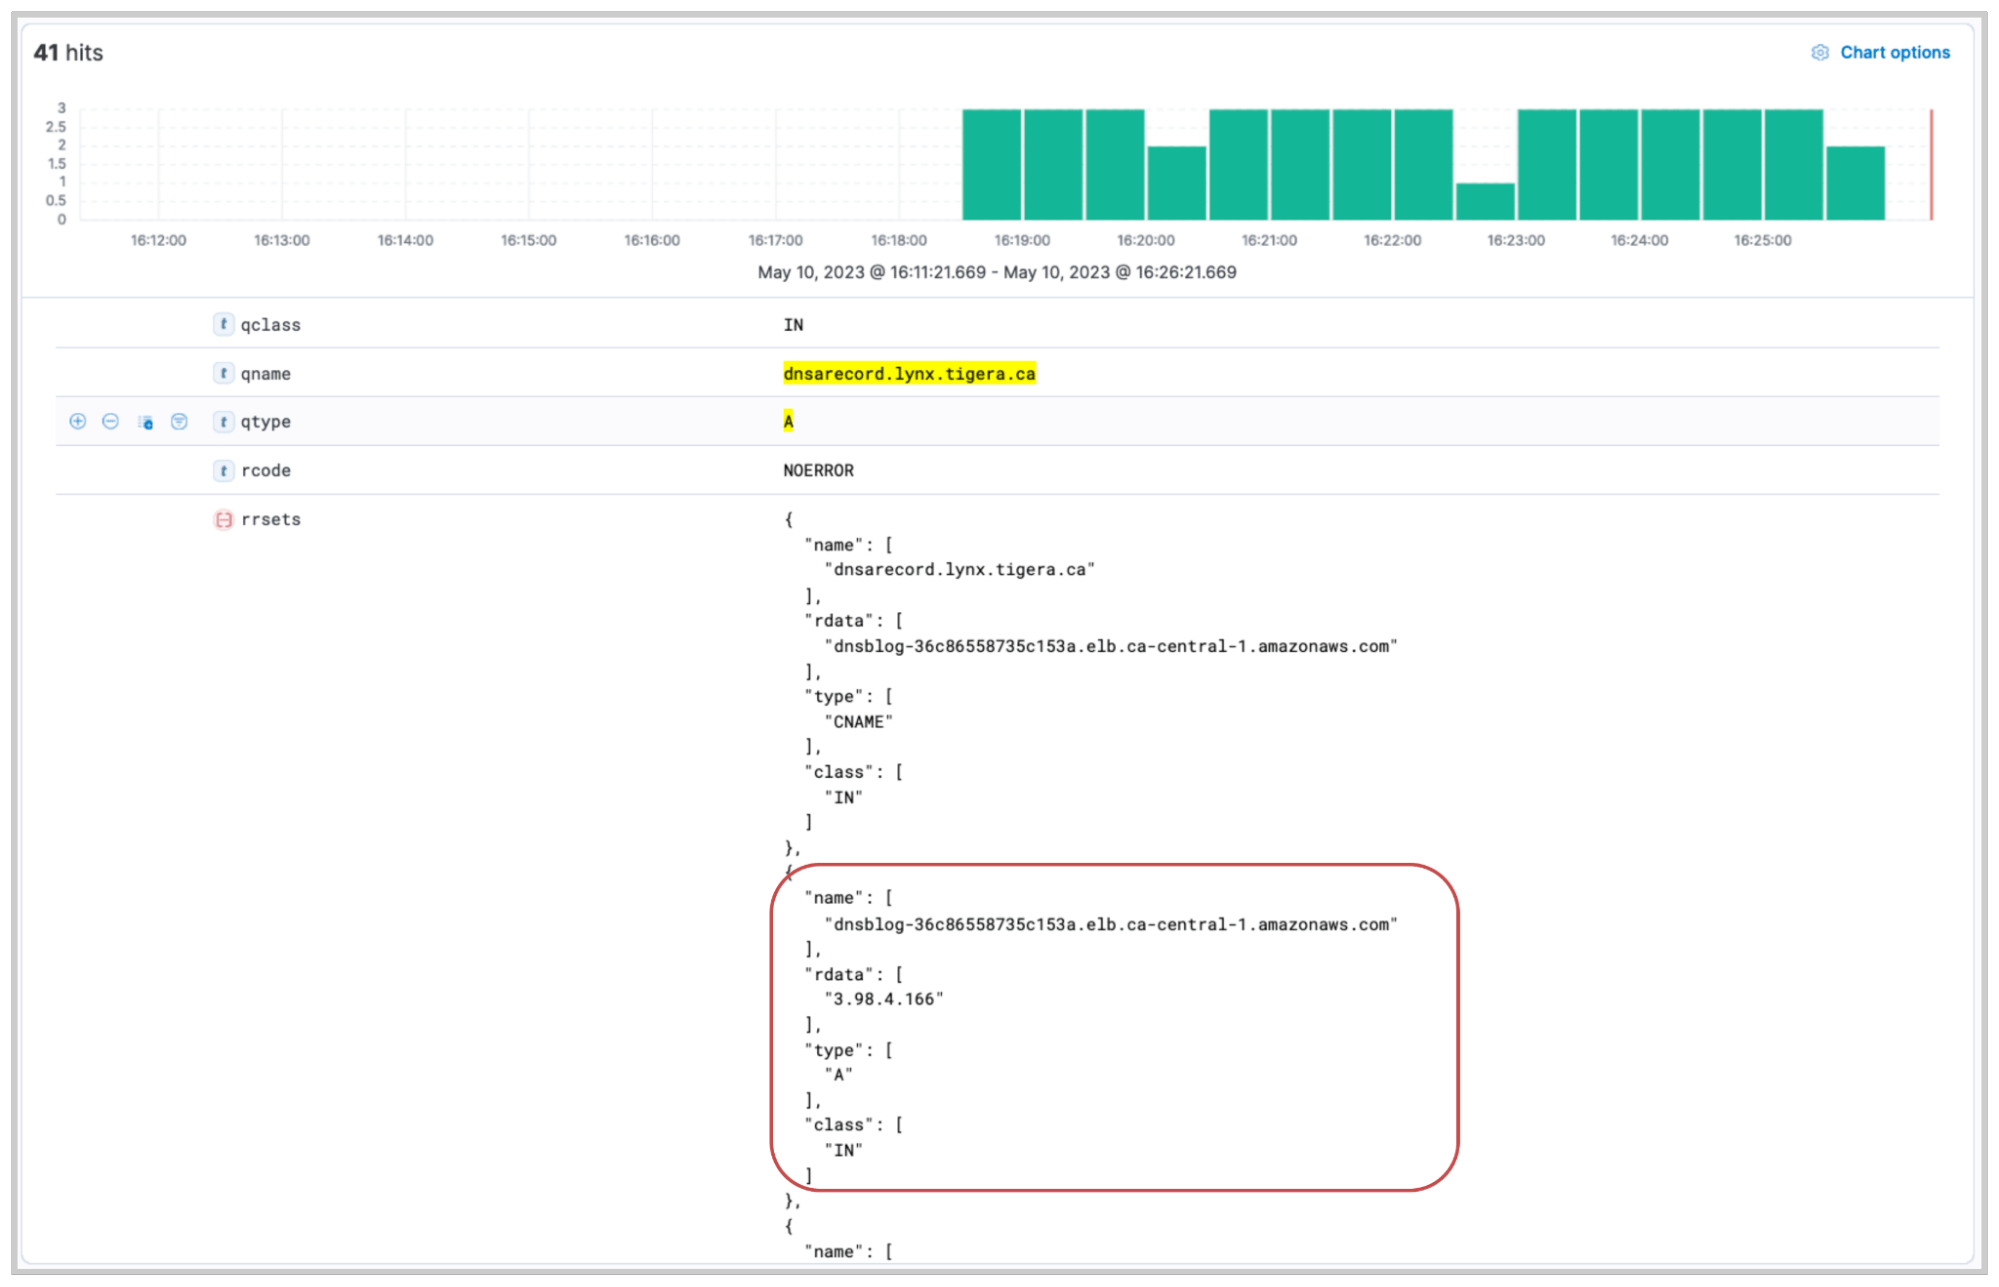
Let’s now look at a similar DNS response with record type CNAME, and the requested A record. We will use the following Kibana query to retrieve the logs.
dns.question.type: A and rrsets:{ type : "CNAME" } AND (rrsets:{ type : "A" })
This time, the resource record set (rrset) shows both the CNAME and the A record. The output indicates that the DNS query for “dnsarecord.lynx.tigera.ca” returned with a CNAME of “dnsblog-36c86558735c153a.elb.ca-central-1.amazonaws.com” and a DNS query for the CNAME returned an A record of “3.98.4.166”.
DNS “NOERROR” with missing record issues, such as the example above, can occur in environments using global site load balancers (GSLB) with delegated zones where there is a misconfiguration or issues in the authoritative nameserver for the delegated zone. Furthermore, GSLBs respond to DNS queries based on the health of backend service pools. Such issues can also be seen when these backend service pools are degraded. Specifically filtering for DNS logs such as these can help identify sporadic or intermittent connectivity issues for applications in the cluster due to problems with upstream name lookups.
“Core-dns” load-balancing issues
It is important that DNS traffic is equally distributed between the available core-dns pods in the cluster. The kube-dns service is typically backed by two or more core-dns pods and is scaled up as needed to ensure high availability and performance.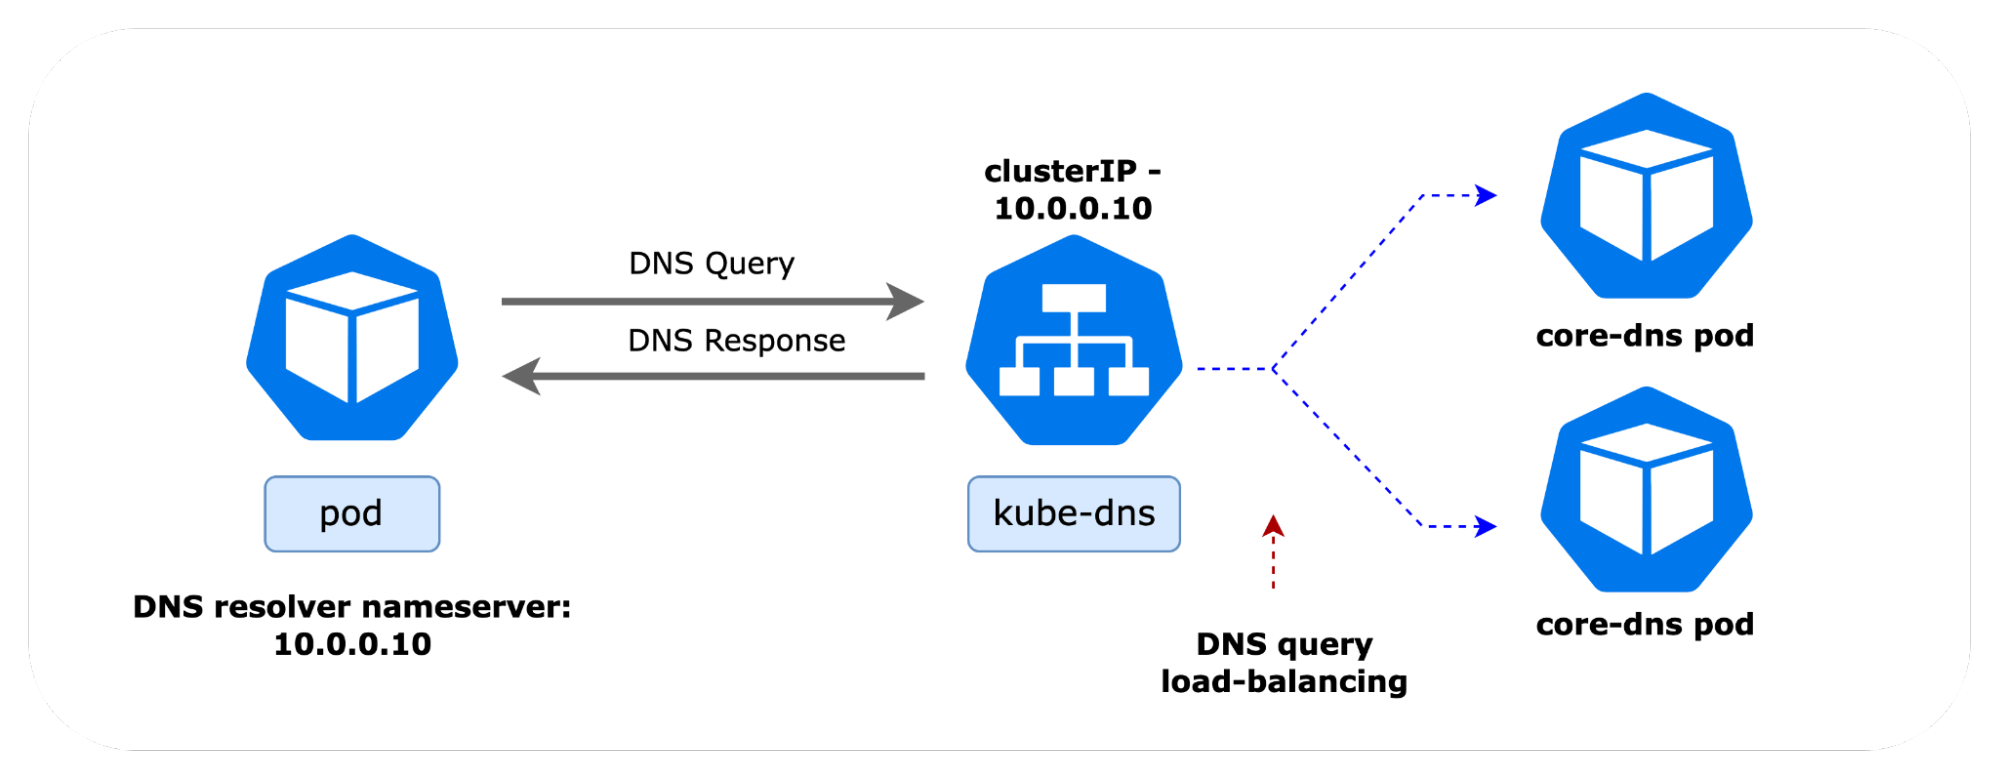
Load balancing ensures that a single pod is not overloaded and the performance of DNS remains acceptable for the cluster’s workloads. Under certain circumstances, due to underlying issues in a node, traffic could get unevenly distributed or sent to a single core-dns pod backing the kube-dns service. The DNS dashboard provides an at-a-glance view to ensure that DNS traffic is evenly distributed. The image below shows the distribution of traffic between two core-dns pods with IPs 10.240.1.58 and 10.240.1.20.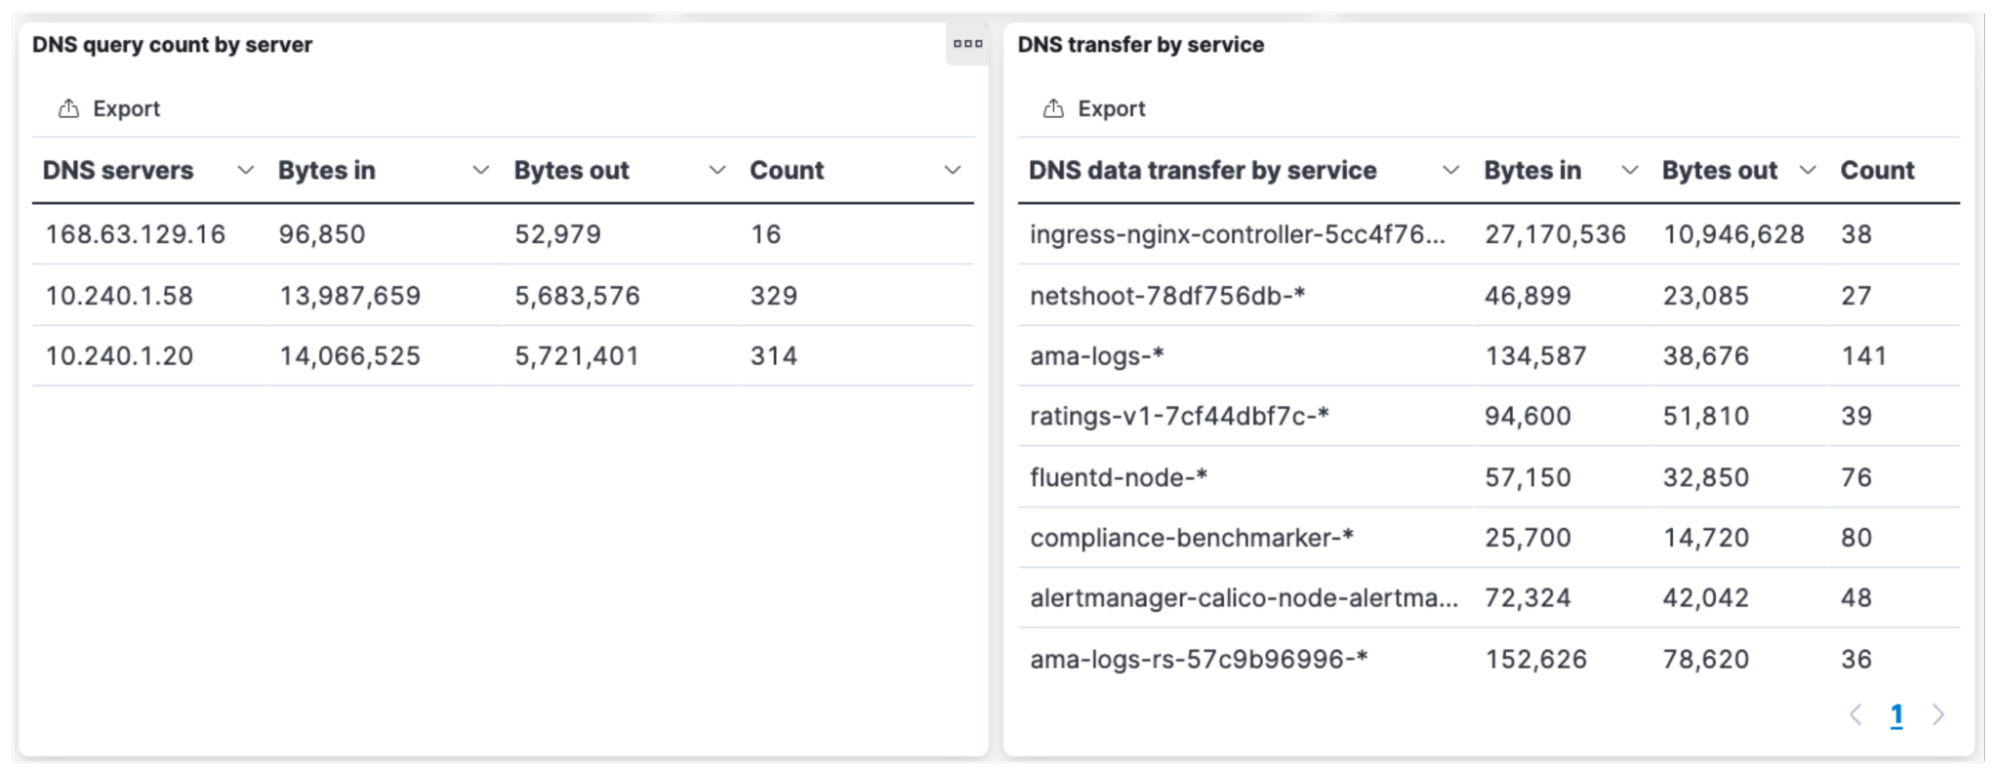
Summary
DNS errors in Kubernetes can cause application performance issues and degrade end-user experience. DevOps and application teams could take days to identify sporadic DNS problems without the right observability solutions. Calico provides a comprehensive set of features that provide instant in-depth visibility into DNS traffic inside the cluster and to external DNS servers to help quickly isolate, and remediate DNS errors.
Want to explore DNS troubleshooting capabilities further? Sign up for a free Calico Cloud trial.