Monitoring is a critical part of any computer system that has been brought in to a production-ready state. No IT system exists in true isolation, and even the simplest systems interact in interesting ways with the systems “surrounding” them. Since compute time, memory, and long-term storage are all finite, it’s necessary at the very least to understand how these things are being allocated.
Why Does the Calico eBPF Data Plane Support Metrics?
Perhaps this question seems contrived. However, it’s always worth spending a moment thinking about reasons before adding any technical complexity to a distributed system! After all, they are already quite complicated! So why does the Calico eBPF data plane support metrics through Prometheus and Grafana?
Well, the Calico eBPF data plane is production ready and widely deployed, so a well-configured Kubernetes cluster with the Calico eBPF data plane correctly enabled will be stable and reliable. However, distributed systems are inherently complex and when dealing with them, it is generally good practice to instrument and baseline metrics wherever they are available. Doing so provides many benefits, especially for capacity planning, change management, and as an early-warning or smoke-testing system.
Additionally, seeing a running distributed system fully instrumented can be greatly beneficial for truly understanding how the system works and therefore how it can be improved.
The Demo Cluster
As the famous quote commonly attributed to Carl Sagan says, “If you wish to make an apple pie from scratch, you must first invent the universe.” Keeping that in mind, my objective in this blog post is to demonstrate how to gain visibility into the Calico eBPF data plane, not to demonstrate building a cluster. So, you might be glad to hear that in the interest of keeping things focused I’ll start from a running, healthy cluster with no Kubernetes CNI installed, rather than starting from bare metal.
Many clusters would be appropriate for this, but in this case my cluster is:
- Running in Google’s GCP (not GKE)
- Running Linux kernel version 5.11.0-1018-gcp
- Built with kubeadm
- No CNI, yet
Here’s what it will look like:
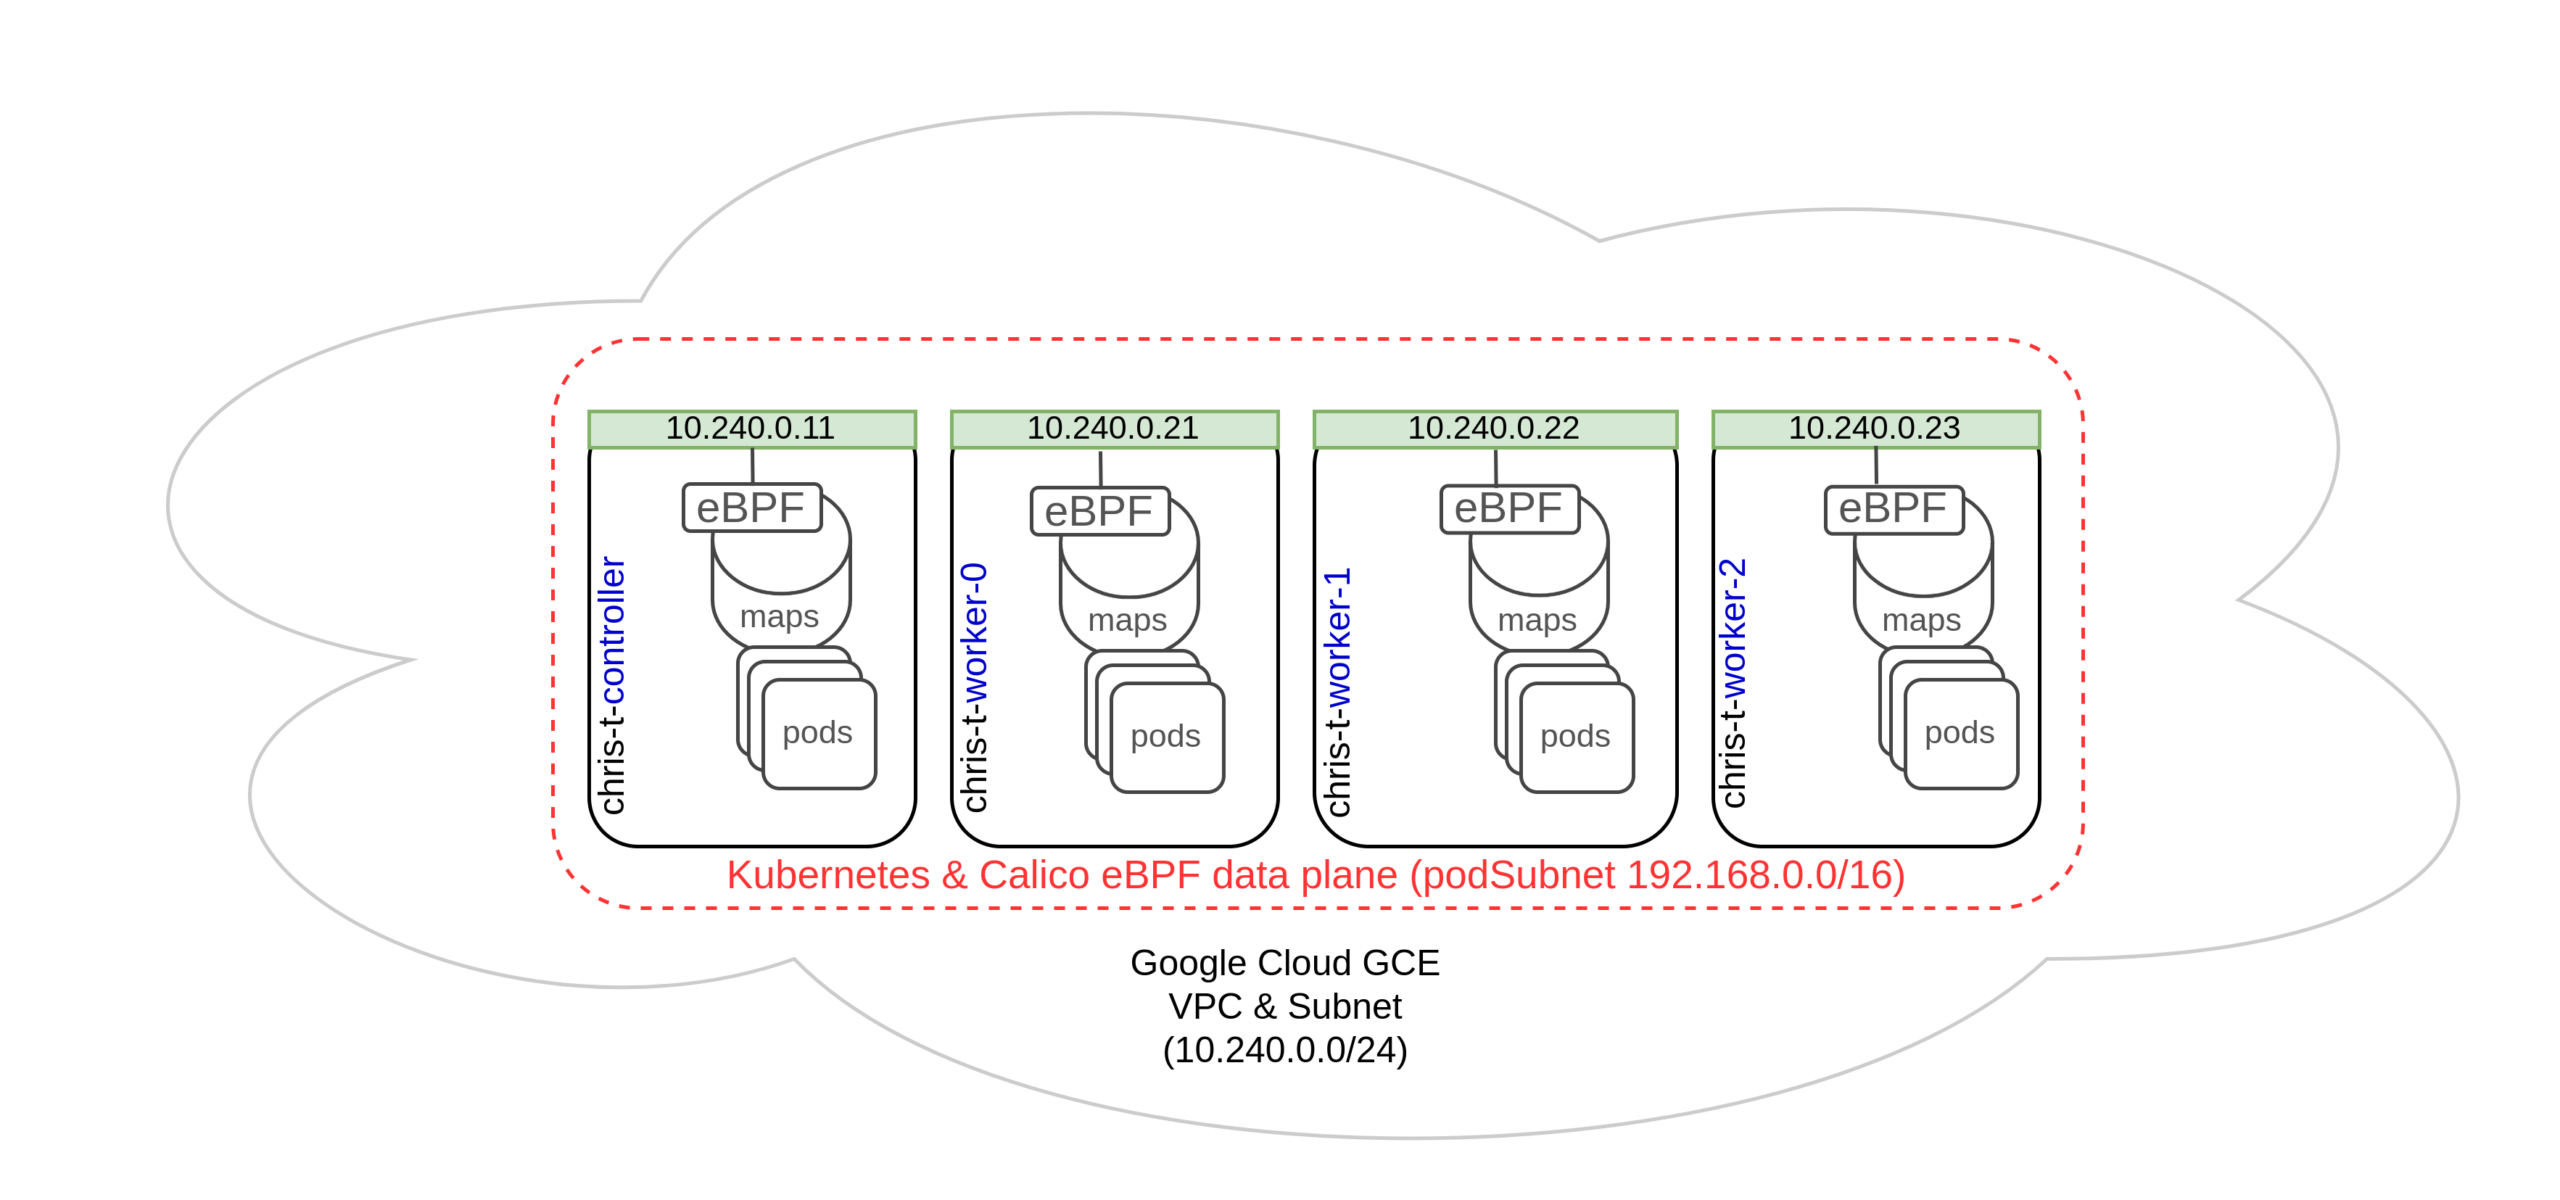 Examining the cluster shows that it is in a NotReady state, which is to be expected since it does not yet have a CNI.
chris @ chris-work ~/2021/2021_11/metrics_demo
└─492─▶ kubectl get nodes -o wide
NAME STATUS ROLES AGE VERSION INTERNAL-IP EXTERNAL-IP OS-IMAGE KERNEL-VERSION CONTAINER-RUNTIME
chris-t-controller NotReady control-plane,master 18h v1.21.4 10.240.0.11 <none> Ubuntu 20.04.3 LTS 5.11.0-1018-gcp docker://20.10.7
chris-t-worker-0 NotReady <none> 17h v1.21.4 10.240.0.20 <none> Ubuntu 20.04.3 LTS 5.11.0-1018-gcp docker://20.10.7
chris-t-worker-1 NotReady <none> 17h v1.21.4 10.240.0.21 <none> Ubuntu 20.04.3 LTS 5.11.0-1018-gcp docker://20.10.7
chris-t-worker-2 NotReady <none> 17h v1.21.4 10.240.0.22 <none> Ubuntu 20.04.3 LTS 5.11.0-1018-gcp docker://20.10.7


chris @ chris-work ~/2021/2021_11/metrics_demo
└─493─▶ kubectl get pods -A
NAMESPACE NAME READY STATUS RESTARTS AGE
kube-system coredns-558bd4d5db-bvkml 0/1 Pending 0 18h
kube-system coredns-558bd4d5db-nl4s9 0/1 Pending 0 18h
kube-system etcd-chris-t-controller 1/1 Running 0 18h
kube-system kube-apiserver-chris-t-controller 1/1 Running 0 18h
kube-system kube-controller-manager-chris-t-controller 1/1 Running 0 18h
kube-system kube-proxy-f8sd7 1/1 Running 0 18h
kube-system kube-proxy-fvz6p 1/1 Running 0 17h
kube-system kube-proxy-grwzq 1/1 Running 0 17h
kube-system kube-proxy-t77zs 1/1 Running 0 17h
kube-system kube-scheduler-chris-t-controller 1/1 Running 0 18h
First, I apply the Tigera Operator, which is an operator following the Operator pattern that is responsible for deploying Calico Open Source on the cluster.
chris @ chris-work ~/2021/2021_11/metrics_demo
└─494─▶ kubectl create -f http://docs.projectcalico.org/manifests/tigera-operator.yaml
customresourcedefinition.apiextensions.k8s.io/bgpconfigurations.crd.projectcalico.org created
customresourcedefinition.apiextensions.k8s.io/bgppeers.crd.projectcalico.org created
customresourcedefinition.apiextensions.k8s.io/blockaffinities.crd.projectcalico.org created
customresourcedefinition.apiextensions.k8s.io/caliconodestatuses.crd.projectcalico.org created
customresourcedefinition.apiextensions.k8s.io/clusterinformations.crd.projectcalico.org created
customresourcedefinition.apiextensions.k8s.io/felixconfigurations.crd.projectcalico.org created
customresourcedefinition.apiextensions.k8s.io/globalnetworkpolicies.crd.projectcalico.org created
customresourcedefinition.apiextensions.k8s.io/globalnetworksets.crd.projectcalico.org created
customresourcedefinition.apiextensions.k8s.io/hostendpoints.crd.projectcalico.org created
customresourcedefinition.apiextensions.k8s.io/ipamblocks.crd.projectcalico.org created
customresourcedefinition.apiextensions.k8s.io/ipamconfigs.crd.projectcalico.org created
customresourcedefinition.apiextensions.k8s.io/ipamhandles.crd.projectcalico.org created
customresourcedefinition.apiextensions.k8s.io/ippools.crd.projectcalico.org created
customresourcedefinition.apiextensions.k8s.io/ipreservations.crd.projectcalico.org created
customresourcedefinition.apiextensions.k8s.io/kubecontrollersconfigurations.crd.projectcalico.org created
customresourcedefinition.apiextensions.k8s.io/networkpolicies.crd.projectcalico.org created
customresourcedefinition.apiextensions.k8s.io/networksets.crd.projectcalico.org created
customresourcedefinition.apiextensions.k8s.io/apiservers.operator.www.tigera.io created
customresourcedefinition.apiextensions.k8s.io/imagesets.operator.www.tigera.io created
customresourcedefinition.apiextensions.k8s.io/installations.operator.www.tigera.io created
customresourcedefinition.apiextensions.k8s.io/tigerastatuses.operator.www.tigera.io created
namespace/tigera-operator created
Warning: policy/v1beta1 PodSecurityPolicy is deprecated in v1.21+, unavailable in v1.25+
podsecuritypolicy.policy/tigera-operator created
serviceaccount/tigera-operator created
clusterrole.rbac.authorization.k8s.io/tigera-operator created
clusterrolebinding.rbac.authorization.k8s.io/tigera-operator created
deployment.apps/tigera-operator created
Next, I create a file defining the Installation and APIServer resources, and apply it to the cluster. In fact, this is just the normal Calico install process documented on the Calico Open Source docs site. The only change is that I have specified a typhaMetricsPort. As noted in the Installation Reference, this specifies which port Calico’s Typha component serves Prometheus metrics on. By default, this is not enabled.
chris @ chris-work ~/2021/2021_11/metrics_demo
└─500─▶ cat << EOF > chris-t-custom-resources.yaml
cat << EOF > chris-t-custom-resources.yaml
apiVersion: operator.www.tigera.io/v1
kind: Installation
metadata:
name: default
spec:
calicoNetwork:
ipPools:
- blockSize: 26
cidr: 192.168.0.0/16
encapsulation: VXLANCrossSubnet
natOutgoing: Enabled
nodeSelector: all()
typhaMetricsPort: 9093
---
apiVersion: operator.www.tigera.io/v1
kind: APIServer
metadata:
name: default
spec: {}
EOF

chris @ chris-work ~/2021/2021_11/metrics_demo
└─501─▶ kubectl create -f chris-t-custom-resources.yaml
installation.operator.www.tigera.io/default created
apiserver.operator.www.tigera.io/default created
Well, that was easy! At this point, the cluster is running Calico. However, I want to use the eBPF data plane, so now I need to enable that. I won’t show the steps in detail here since I did not deviate at all from the documented process for enabling the eBPF data plane on a Calico cluster. At a high level, I:
- Created a ConfigMap resource instructing Calico to talk directly to the Kubernetes API rather than via kube-proxy
- Instructed the cluster to disable kube-proxy
- Changed the Installation resource to instruct the Tigera Operator to enable the eBPF data plane
If you want to know more about those steps, remember that besides the documentation above, there are lots of experienced community members in the #eBPF channel on the Calico Users Slack who can help.
Understanding the Available Targets
You probably don’t really need to know exactly what metrics look like on the various targets in a Kubernetes cluster using Calico’s eBPF data plane, but it is often a good idea to dive into the details a little to get some insights. Metrics in this kind of cluster are available from:
- Typha (Calico’s datastore fan-out daemon)
- calico-kube-controllers (Calico’s container for the controllers that perform actions based on cluster state)
- Felix (Calico’s per-node agent)
Understanding Discovery Services
One subtlety of monitoring all three of the above targets is how Kubernetes services are used. They are not used in the traditional way! I’ll give the example of Felix, but it relates to all of the available targets.
This is perhaps best explained with a diagram. As shown in the black lines in the diagram below, services in Kubernetes are usually used to forward traffic to a set of service pods. However, consider the case of Felix metrics collection. Each Felix pod has different metrics, and I want Prometheus to collect them all. If it was load-balanced by the service, that would result in each request for metrics being balanced to a different pod, and data being missed or muddled.
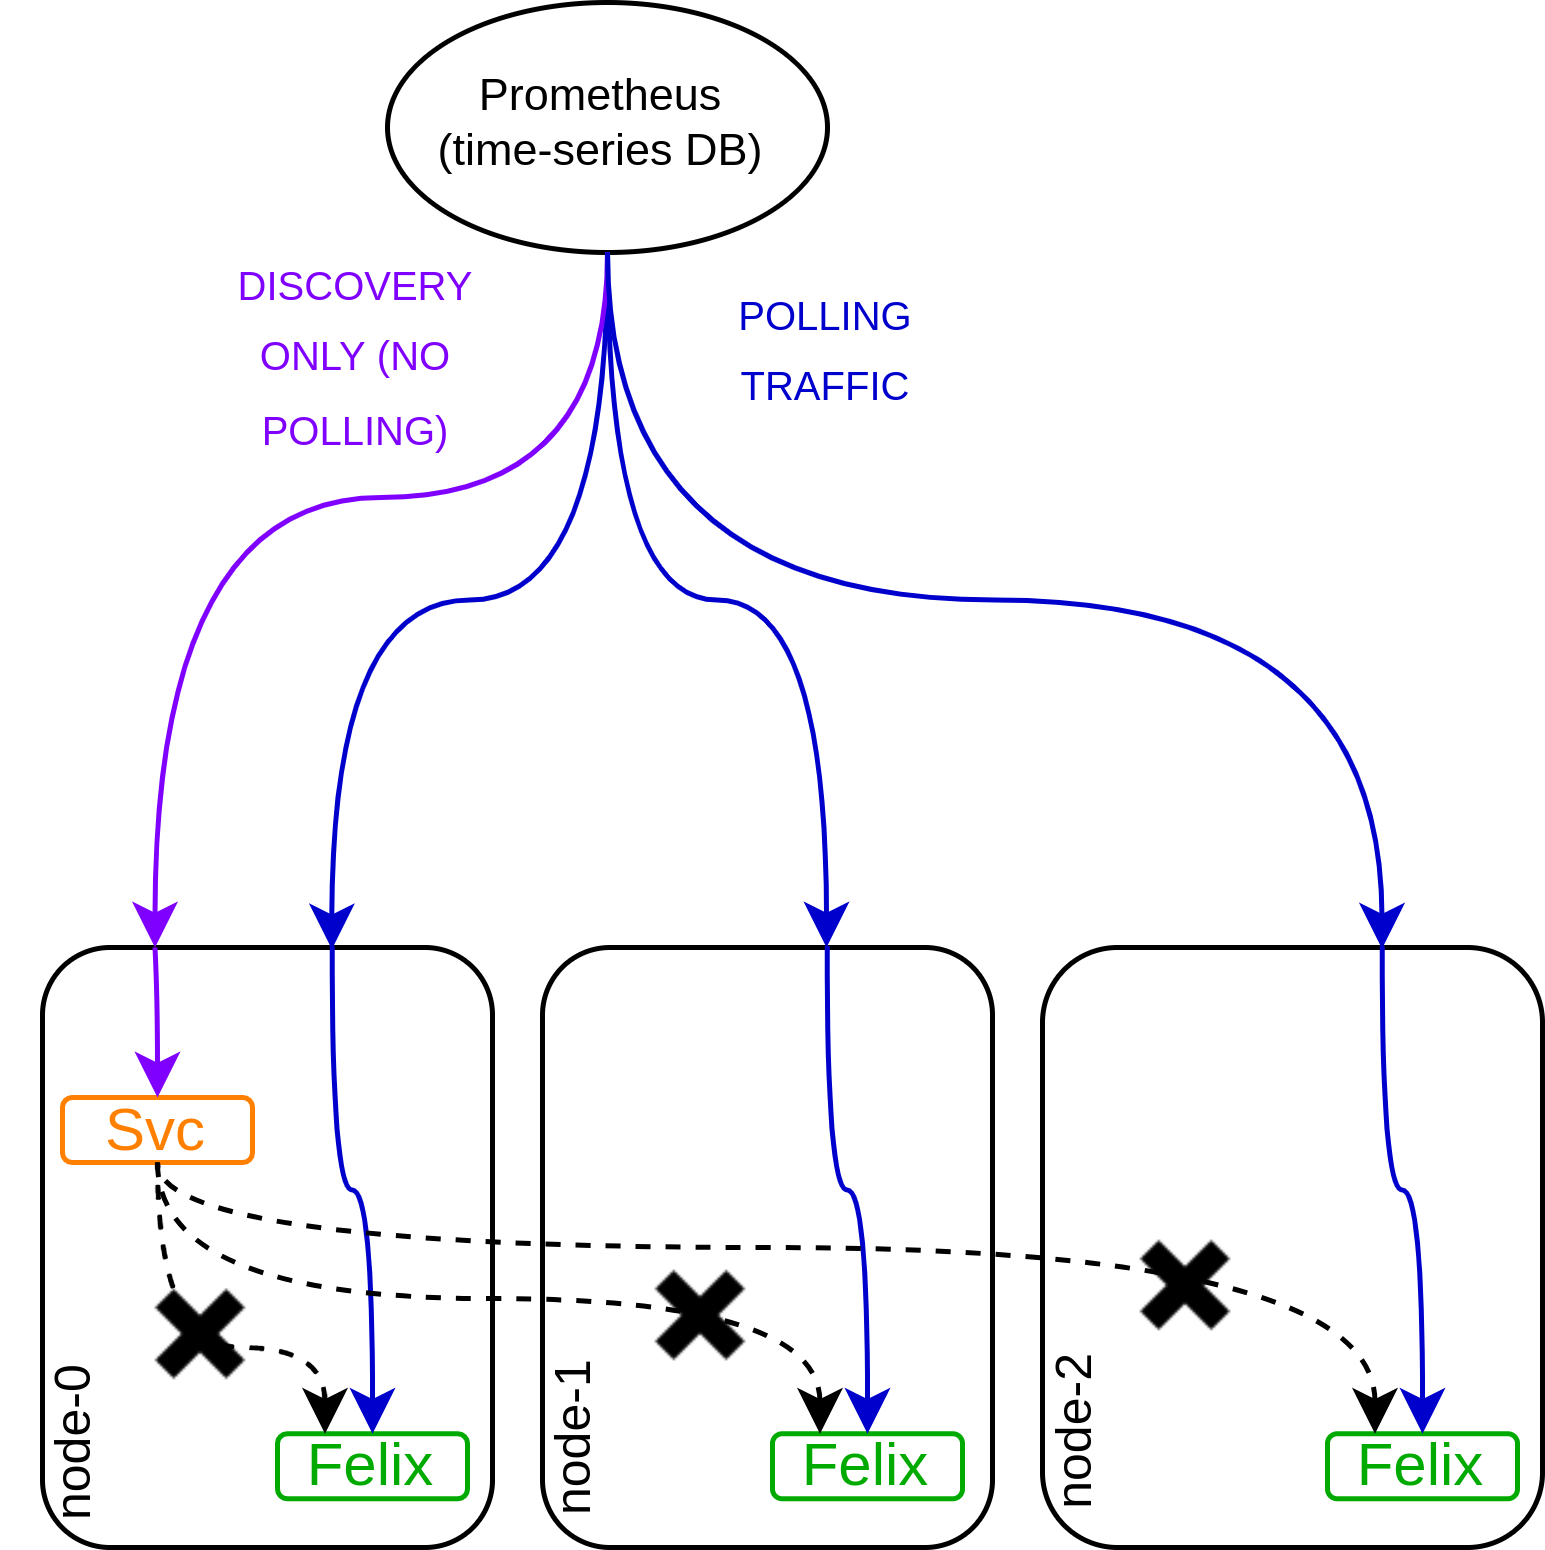
Therefore, the service is used for discovery only. When Prometheus wants to know where the metrics endpoints are, it does query the service, but the actual polling traffic is always sent directly to the target pod, never via the service.
This use of a service is interesting and non-intuitive. This discovery mode is called the endpoints role, and is in this Prometheus documentation. I wondered if it might have been better to use a different method for this kind of discovery. After a little investigation, I believe that at the time that this Calico functionality was originally designed, the endpoints role was recommended, though Prometheus now offers an additional pod role that could be used as an alternative if this functionality is being improved or reimplemented.
For the time being though, this is a simple and feature-complete implementation that conforms to the Prometheus documentation.
Typha’s Metrics
To view Typha’s metrics, I first grab the IP of one of the nodes running a Typha pod, and then curl port 9093 from within the cluster.
chris @ chris-work ~/2021/2021_11/metrics_demo
└─518─▶ kubectl get pods -A -o wide | grep -i typha
calico-system calico-typha-79db7f5747-8m4sv 1/1 Running 0 3h32m 10.240.0.20 chris-t-worker-0 <none> <none>
calico-system calico-typha-79db7f5747-qtlsk 1/1 Running 0 3h32m 10.240.0.22 chris-t-worker-2 <none> <none>


chris @ chris-work ~/2021/2021_11/metrics_demo
└─519─▶ gcloud compute ssh ubuntu@chris-t-controller --zone us-central1-a --command "curl -s http://10.240.0.20:9093/metrics" | head -n 10
# HELP go_gc_duration_seconds A summary of the pause duration of garbage collection cycles.
# TYPE go_gc_duration_seconds summary
go_gc_duration_seconds{quantile="0"} 2.1838e-05
go_gc_duration_seconds{quantile="0.25"} 0.000117127
go_gc_duration_seconds{quantile="0.5"} 0.000134296
go_gc_duration_seconds{quantile="0.75"} 0.000169608
go_gc_duration_seconds{quantile="1"} 0.00040328
go_gc_duration_seconds_sum 0.017567578
go_gc_duration_seconds_count 116
# HELP go_goroutines Number of goroutines that currently exist.
The output above shows that the Typha pod is correctly responding on port 9093 as I configured.
Next, I create the discovery service that Prometheus will use, and grab its IP.
chris @ chris-work ~/2021/2021_11/metrics_demo
└─520─▶ kubectl apply -f - <<EOF
apiVersion: v1
kind: Service
metadata:
name: typha-metrics-svc
namespace: calico-system
spec:
selector:
k8s-app: calico-typha
ports:
- port: 9093
targetPort: 9093
EOF

service/typha-metrics-svc created


chris @ chris-work ~/2021/2021_11/metrics_demo
└─521─▶ kubectl get services -n=calico-system typha-metrics-svc
NAME TYPE CLUSTER-IP EXTERNAL-IP PORT(S) AGE
typha-metrics-svc ClusterIP 10.100.83.54 <none> 9093/TCP 16s
I will test the service to ensure it’s responding, but keep in mind the caveat in the previous section: this service is not actually polled in this way once Prometheus is running.
chris @ chris-work ~/2021/2021_11/metrics_demo
└─522─▶ gcloud compute ssh ubuntu@chris-t-controller --zone us-central1-a --command "curl -s http://10.100.83.54:9093/metrics" | head -n 10
# HELP go_gc_duration_seconds A summary of the pause duration of garbage collection cycles.
# TYPE go_gc_duration_seconds summary
go_gc_duration_seconds{quantile="0"} 2.1838e-05
go_gc_duration_seconds{quantile="0.25"} 0.000117127
go_gc_duration_seconds{quantile="0.5"} 0.000135733
go_gc_duration_seconds{quantile="0.75"} 0.000169189
go_gc_duration_seconds{quantile="1"} 0.00040328
go_gc_duration_seconds_sum 0.017886049
go_gc_duration_seconds_count 118
# HELP go_goroutines Number of goroutines that currently exist.
That’s it, for now! Once we add Prometheus to the cluster, we will pass it the name of this service to enable discovery.
calico-kube-controllers’ Metrics
The process for calico-kube-controllers is very similar. First, I confirm the configured port. In this case, it’s the default port 9094. Then I grab the pod IP and test from within the cluster, as before.
chris @ chris-work ~/2021/2021_11/metrics_demo
└─527─▶ kubectl get kubecontrollersconfiguration default -o yaml | grep -i prometheusMetricsPort
prometheusMetricsPort: 9094


chris @ chris-work ~/2021/2021_11/metrics_demo
└─528─▶ kubectl get pods -A -o wide | grep -i calico-kube-controllers
calico-system calico-kube-controllers-669995d4df-q9sd8 1/1 Running 0 3h57m 192.168.203.4 chris-t-worker-1 <none> <none>


chris @ chris-work ~/2021/2021_11/metrics_demo
└─529─▶ gcloud compute ssh ubuntu@chris-t-controller --zone us-central1-a --command "curl -s http://192.168.203.4:9094/metrics" | head -n 10# HELP go_gc_duration_seconds A summary of the pause duration of garbage collection cycles.
# TYPE go_gc_duration_seconds summary
go_gc_duration_seconds{quantile="0"} 8.5216e-05
go_gc_duration_seconds{quantile="0.25"} 0.000153376
go_gc_duration_seconds{quantile="0.5"} 0.000180758
go_gc_duration_seconds{quantile="0.75"} 0.000216069
go_gc_duration_seconds{quantile="1"} 0.002992162
go_gc_duration_seconds_sum 0.028429418
go_gc_duration_seconds_count 128
# HELP go_goroutines Number of goroutines that currently exist.
Next, as before, I create the discovery service that Prometheus will use, and grab its IP.
chris @ chris-work ~/2021/2021_11/metrics_demo
└─530─▶ kubectl apply -f - <<EOF
apiVersion: v1
kind: Service
metadata:
name: kube-controllers-metrics-svc
namespace: calico-system
spec:
selector:
k8s-app: calico-kube-controllers
ports:
- port: 9094
targetPort: 9094
EOF
service/kube-controllers-metrics-svc created


chris @ chris-work ~/2021/2021_11/metrics_demo
└─531─▶ kubectl get services -n=calico-system kube-controllers-metrics-svc
NAME TYPE CLUSTER-IP EXTERNAL-IP PORT(S) AGE
kube-controllers-metrics-svc ClusterIP 10.98.85.108 <none> 9094/TCP 25s
Again, I will test the service to ensure it’s responding, with the same caveat as before.
chris @ chris-work ~/2021/2021_11/metrics_demo
└─533─▶ gcloud compute ssh ubuntu@chris-t-controller --zone us-central1-a --command "curl -s http://10.98.85.108:9094/metrics" | head -n 10
# HELP go_gc_duration_seconds A summary of the pause duration of garbage collection cycles.
# TYPE go_gc_duration_seconds summary
go_gc_duration_seconds{quantile="0"} 8.5216e-05
go_gc_duration_seconds{quantile="0.25"} 0.000153376
go_gc_duration_seconds{quantile="0.5"} 0.000180758
go_gc_duration_seconds{quantile="0.75"} 0.000216069
go_gc_duration_seconds{quantile="1"} 0.002992162
go_gc_duration_seconds_sum 0.029002837
go_gc_duration_seconds_count 131
# HELP go_goroutines Number of goroutines that currently exist.
That’s it! Again, once we add Prometheus, we will pass it the name of this service to enable discovery.
Felix’s metrics
Finally, let’s repeat the process for Felix. This time, I enable metrics reporting by setting prometheusMetricsEnabled to true in the default FelixConfiguration resource. Then I grab the node IP and test from within the cluster, as before.
chris @ chris-work ~/2021/2021_11/metrics_demo
└─535─▶ kubectl patch felixConfiguration default --patch '{"spec":{"prometheusMetricsEnabled": true}}'
Successfully patched 1 'FelixConfiguration' resource


chris @ chris-work ~/2021/2021_11/metrics_demo
└─536─▶ kubectl get felixConfiguration default -o yaml
apiVersion: projectcalico.org/v3
kind: FelixConfiguration
metadata:
creationTimestamp: "2022-01-05T09:51:31Z"
name: default
resourceVersion: "144928"
uid: 17977eaf-7324-4da1-a4a0-54e46c5f0b93
spec:
bpfLogLevel: ""
logSeverityScreen: Info
prometheusMetricsEnabled: true
reportingInterval: 0s
vxlanEnabled: true


chris @ chris-work ~/2021/2021_11/metrics_demo
└─537─▶ kubectl get node -o wide
NAME STATUS ROLES AGE VERSION INTERNAL-IP EXTERNAL-IP OS-IMAGE KERNEL-VERSION CONTAINER-RUNTIME
chris-t-controller Ready control-plane,master 23h v1.21.4 10.240.0.11 <none> Ubuntu 20.04.3 LTS 5.11.0-1018-gcp docker://20.10.7
chris-t-worker-0 Ready <none> 22h v1.21.4 10.240.0.20 <none> Ubuntu 20.04.3 LTS 5.11.0-1018-gcp docker://20.10.7
chris-t-worker-1 Ready <none> 22h v1.21.4 10.240.0.21 <none> Ubuntu 20.04.3 LTS 5.11.0-1018-gcp docker://20.10.7
chris-t-worker-2 Ready <none> 22h v1.21.4 10.240.0.22 <none> Ubuntu 20.04.3 LTS 5.11.0-1018-gcp docker://20.10.7


chris @ chris-work ~/2021/2021_11/metrics_demo
└─538─▶ gcloud compute ssh ubuntu@chris-t-controller --zone us-central1-a --command "curl -s http://10.240.0.20:9091/metrics" | head -n 10
# HELP felix_active_local_endpoints Number of active endpoints on this host.
# TYPE felix_active_local_endpoints gauge
felix_active_local_endpoints 1
# HELP felix_active_local_policies Number of active policies on this host.
# TYPE felix_active_local_policies gauge
felix_active_local_policies 0
# HELP felix_active_local_selectors Number of active selectors on this host.
# TYPE felix_active_local_selectors gauge
felix_active_local_selectors 0
# HELP felix_active_local_tags Number of active tags on this host.
Next, as before, I create the discovery service that Prometheus will use, and grab its IP.
chris @ chris-work ~/2021/2021_11/metrics_demo
└─539─▶ kubectl apply -f - <<EOF
apiVersion: v1
kind: Service
metadata:
name: felix-metrics-svc
namespace: calico-system
spec:
selector:
k8s-app: calico-node
ports:
- port: 9091
targetPort: 9091
EOF

service/felix-metrics-svc created


chris @ chris-work ~/2021/2021_11/metrics_demo
└─540─▶ kubectl get services -n=calico-system felix-metrics-svc
NAME TYPE CLUSTER-IP EXTERNAL-IP PORT(S) AGE
felix-metrics-svc ClusterIP 10.99.145.23 <none> 9091/TCP 7s
Again, I will test the service to ensure it’s responding, with the same caveat as before.
chris @ chris-work ~/2021/2021_11/metrics_demo
└─542─▶ gcloud compute ssh ubuntu@chris-t-controller --zone us-central1-a --command "curl -s http://10.99.145.23:9091/metrics | head -n 10"
# HELP felix_active_local_endpoints Number of active endpoints on this host.
# TYPE felix_active_local_endpoints gauge
felix_active_local_endpoints 2
# HELP felix_active_local_policies Number of active policies on this host.
# TYPE felix_active_local_policies gauge
felix_active_local_policies 1
# HELP felix_active_local_selectors Number of active selectors on this host.
# TYPE felix_active_local_selectors gauge
felix_active_local_selectors 0
# HELP felix_active_local_tags Number of active tags on this host.
That’s it! Again, once we add Prometheus, we will pass it the name of this service to enable discovery.
Enable Prometheus on the cluster
Up until this point, I have been enabling metrics endpoints on monitorable services in the Calico-eBPF-data-plane Kubernetes cluster. This does not mean that any statistics are actually being collected! All I have done so far is enable the HTTP targets that make the data available for Prometheus to collect.
In order to actually start collecting the statistics, I need to install the central Prometheus instance (pod) that collects the data in a time-series database.
First, I need to create a namespace to host it.
chris @ chris-work ~/2021/2021_11/metrics_demo
└─543─▶ kubectl apply -f -<<EOF
apiVersion: v1
kind: Namespace
metadata:
name: calico-monitoring
labels:
app: ns-calico-monitoring
role: monitoring
EOF

namespace/calico-monitoring created
Next, I need to create a ClusterRole, which represents the actions and resources I want to allow the Prometheus service to access. After that, I must create a ServiceAccount for the Prometheus service, and bind the two using a ClusterRoleBinding.
chris @ chris-work ~/2021/2021_11/metrics_demo
└─545─▶ kubectl apply -f - <<EOF
apiVersion: rbac.authorization.k8s.io/v1
kind: ClusterRole
metadata:
name: calico-prometheus-user
rules:
- apiGroups: [""]
resources:
- endpoints
- services
- pods
verbs: ["get", "list", "watch"]
- nonResourceURLs: ["/metrics"]
verbs: ["get"]
---
apiVersion: v1
kind: ServiceAccount
metadata:
name: calico-prometheus-user
namespace: calico-monitoring
---
apiVersion: rbac.authorization.k8s.io/v1
kind: ClusterRoleBinding
metadata:
name: calico-prometheus-user
roleRef:
apiGroup: rbac.authorization.k8s.io
kind: ClusterRole
name: calico-prometheus-user
subjects:
- kind: ServiceAccount
name: calico-prometheus-user
namespace: calico-monitoring
EOF

clusterrole.rbac.authorization.k8s.io/calico-prometheus-user created
serviceaccount/calico-prometheus-user created
clusterrolebinding.rbac.authorization.k8s.io/calico-prometheus-user created
After that, I need to create a configuration file for Prometheus, and store it in a ConfigMap, as is commonplace for providing configuration files to Kubernetes-based services. In particular, notice how the three kubernetes_sd_configs are included, with role: endpoints statements, and each points to one of the services we configured and tested. This is how Prometheus will discover the endpoints.
chris @ chris-work ~/2021/2021_11/metrics_demo
└─546─▶ kubectl apply -f - <<EOF
apiVersion: v1
kind: ConfigMap
metadata:
name: prometheus-config
namespace: calico-monitoring
data:
prometheus.yml: |-
global:
scrape_interval: 15s
external_labels:
monitor: 'tutorial-monitor'
scrape_configs:
- job_name: 'prometheus'
scrape_interval: 5s
static_configs:
- targets: ['localhost:9090']
- job_name: 'felix_metrics'
scrape_interval: 5s
scheme: http
kubernetes_sd_configs:
- role: endpoints
relabel_configs:
- source_labels: [__meta_kubernetes_service_name]
regex: felix-metrics-svc
replacement: $1
action: keep
- job_name: 'typha_metrics'
scrape_interval: 5s
scheme: http
kubernetes_sd_configs:
- role: endpoints
relabel_configs:
- source_labels: [__meta_kubernetes_service_name]
regex: typha-metrics-svc
replacement: $1
action: keep
- job_name: 'kube_controllers_metrics'
scrape_interval: 5s
scheme: http
kubernetes_sd_configs:
- role: endpoints
relabel_configs:
- source_labels: [__meta_kubernetes_service_name]
regex: calico-kube-controllers-metrics
replacement: $1
action: keep
EOF
configmap/prometheus-config created
Now that the targets and services are configured, and Prometheus has a configuration file stored in the ConfigMap, it’s time that I create the pod that will load the configuration and actually start doing the statistics collection work. Doing so is just a case of creating a Pod Kubernetes resource, which actually specifies what image should run and with what resources and configuration, and a Service Kubernetes resource that presents the new Prometheus pod as a service consumable by anything else in the cluster.
chris @ chris-work ~/2021/2021_11/metrics_demo
└─487─▶ kubectl apply -f - <<EOF
apiVersion: v1
kind: Pod
metadata:
name: prometheus-pod
namespace: calico-monitoring
labels:
app: prometheus-pod
role: monitoring
spec:
serviceAccountName: calico-prometheus-user
containers:
- name: prometheus-pod
image: prom/prometheus
resources:
limits:
memory: "128Mi"
cpu: "500m"
volumeMounts:
- name: config-volume
mountPath: /etc/prometheus/prometheus.yml
subPath: prometheus.yml
ports:
- containerPort: 9090
volumes:
- name: config-volume
configMap:
name: prometheus-config
EOF

chris @ chris-work ~/2021/2021_11/metrics_demo
└─488─▶ kubectl apply -f - <<EOF
apiVersion: v1
kind: Service
metadata:
name: prometheus-dashboard-svc
namespace: calico-monitoring
spec:
selector:
app: prometheus-pod
role: monitoring
ports:
- port: 9090
targetPort: 9090
EOF
service/prometheus-dashboard-svc created

chris @ chris-work ~/2021/2021_11/metrics_demo
└─489─▶ kubectl port-forward service/prometheus-dashboard-svc 9090:9090 -n calico-monitoring
Forwarding from 127.0.0.1:9090 -> 9090
Forwarding from [::1]:9090 -> 9090
That’s it! Prometheus is running.
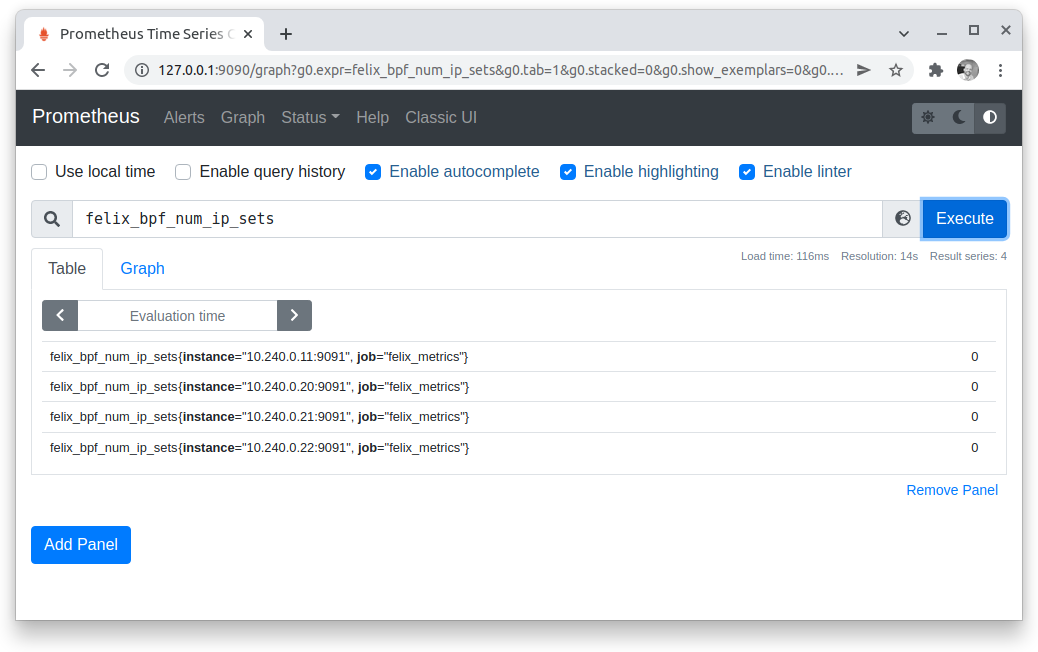 At this point I can query the data, but Prometheus is usually used with Grafana as a visualization frontend.
Enable Grafana
Luckily, setting up Grafana is easy. First, I just add a config file in a ConfigMap as I did for Prometheus. The configuration is minimal; it just needs to instruct Grafana where to find the Prometheus service I set up.
chris @ chris-work ~/2021/2021_11/metrics_demo
└─491─▶ kubectl apply -f - <<EOF
apiVersion: v1
kind: ConfigMap
metadata:
name: grafana-config
namespace: calico-monitoring
data:
prometheus.yaml: |-
{
"apiVersion": 1,
"datasources": [
{
"access":"proxy",
"editable": true,
"name": "calico-demo-prometheus",
"orgId": 1,
"type": "prometheus",
"url": "http://prometheus-dashboard-svc.calico-monitoring.svc:9090",
"version": 1
}
]
}
EOF
configmap/grafana-config created
Then, I create a ConfigMap with some stock Felix and Typha dashboards.
chris @ chris-work ~/2021/2021_11/metrics_demo
└─492─▶ kubectl apply -f http://docs.projectcalico.org/manifests/grafana-dashboards.yaml
configmap/grafana-dashboards-config created
Next, I create the Grafana pod.
chris @ chris-work ~/2021/2021_11/metrics_demo
└─493─▶ kubectl apply -f - <<EOF
apiVersion: v1
kind: Pod
metadata:
name: grafana-pod
namespace: calico-monitoring
labels:
app: grafana-pod
role: monitoring
spec:
containers:
- name: grafana-pod
image: grafana/grafana:latest
resources:
limits:
memory: "128Mi"
cpu: "500m"
volumeMounts:
- name: grafana-config-volume
mountPath: /etc/grafana/provisioning/datasources
- name: grafana-dashboards-volume
mountPath: /etc/grafana/provisioning/dashboards
- name: grafana-storage-volume
mountPath: /var/lib/grafana
ports:
- containerPort: 3000
volumes:
- name: grafana-storage-volume
emptyDir: {}
- name: grafana-config-volume
configMap:
name: grafana-config
- name: grafana-dashboards-volume
configMap:
name: grafana-dashboards-config
EOF
pod/grafana-pod created

chris @ chris-work ~/2021/2021_11/metrics_demo
└─494─▶ kubectl port-forward pod/grafana-pod 3000:3000 -n calico-monitoring
Forwarding from 127.0.0.1:3000 -> 3000
Forwarding from [::1]:3000 -> 3000
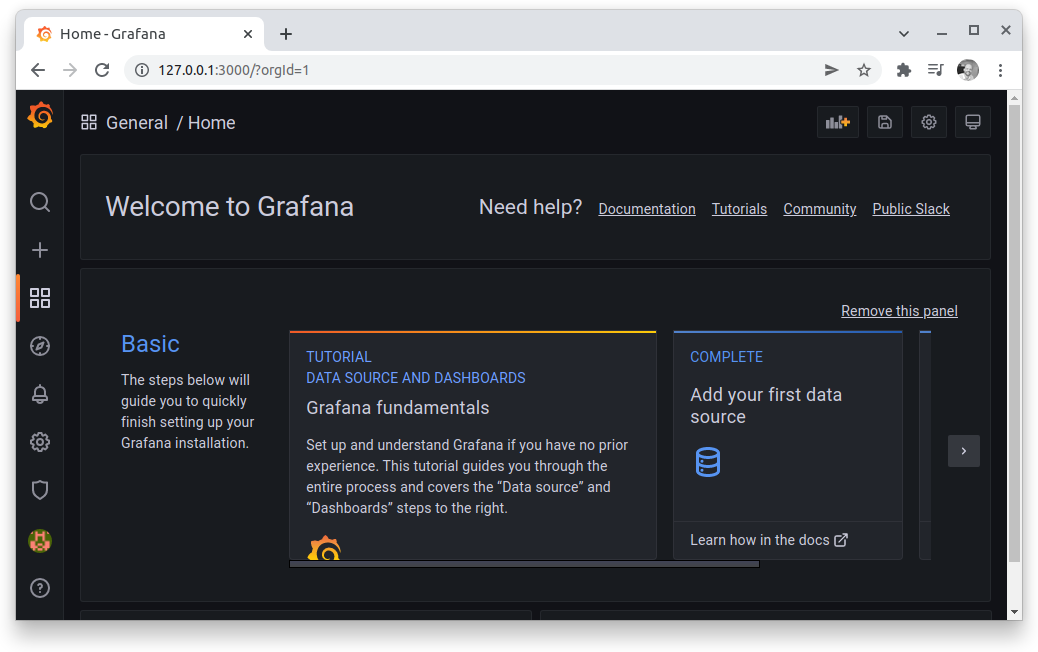
And that’s it, Grafana is running! The default username and password is admin/admin, so I can log in and start creating dashboards and visualizations.
 Next steps
At this point, you can explore, learn about, and create visualizations and dashboards for the available eBPF data plane metrics that are now being ingested by Prometheus. In a follow-on blog post, we will examine the available metrics and what can be learned from them.
Did you know you can become a certified Calico operator? Learn container and Kubernetes networking and security fundamentals using Calico in this free, self-paced certification course.
There are additional level two courses as well. One of them specifically addresses eBPF and the Calico eBPF data plane!
Join our mailing list
Get updates on blog posts, workshops, certification programs, new releases, and more!