In the guide about setting up Kubernetes 1.9.0 using kubeadm on Raspberry Pis, RBAC was enabled by default. This blog post will show how to run the Kubernetes dashboard with RBAC enabled.
Prerequisites
Setting up kubeconfig
Let’s configure your local machine to communicate with your cluster using kubectl when your cluster from the previous guide has been set up.
Download the config from your master node using scp
$ scp pi@master.local:/home/pi/.kube/config ./configCopy the config into your local machine’s ~/.kube directory.
NOTICE! If you already have a cluster configuration, this will overwrite that configuration! In that case you can use the double dash — kubeconfig flag instead of copying the file or merging the configs.
$ cp config ~/.kube/configTest the configuration by listing the cluster nodes:
$ kubectl get nodes
NAME        STATUS    ROLES     AGE       VERSION
master      Ready     master    27m       v1.9.0
worker-01   Ready     <none>    25m       v1.9.0
worker-02   Ready     <none>    25m       v1.9.0
worker-03   Ready     <none>    25m       v1.9.0
Creating the dashboard
The Kubernetes source creates several resources in the kube-systemnamespace: secret, service account, role, rolebinding, deployment, and service.
$ kubectl create -f https://raw.githubusercontent.com/kubernetes/dashboard/master/src/deploy/recommended/kubernetes-dashboard-arm.yaml
secret "kubernetes-dashboard-certs" created
serviceaccount "kubernetes-dashboard" created
role "kubernetes-dashboard-minimal" created
rolebinding "kubernetes-dashboard-minimal" created
deployment "kubernetes-dashboard" created
service "kubernetes-dashboard" created
Afterwards, you will be able to start a proxy from your local machine to access the service you just created.
kubectl proxyThe dashboard is accessible at http://localhost:8001/ui. Since kubectlhandles the proxy to the API Server and binds to port 8001 (default) on your host machine, the url points to localhost.
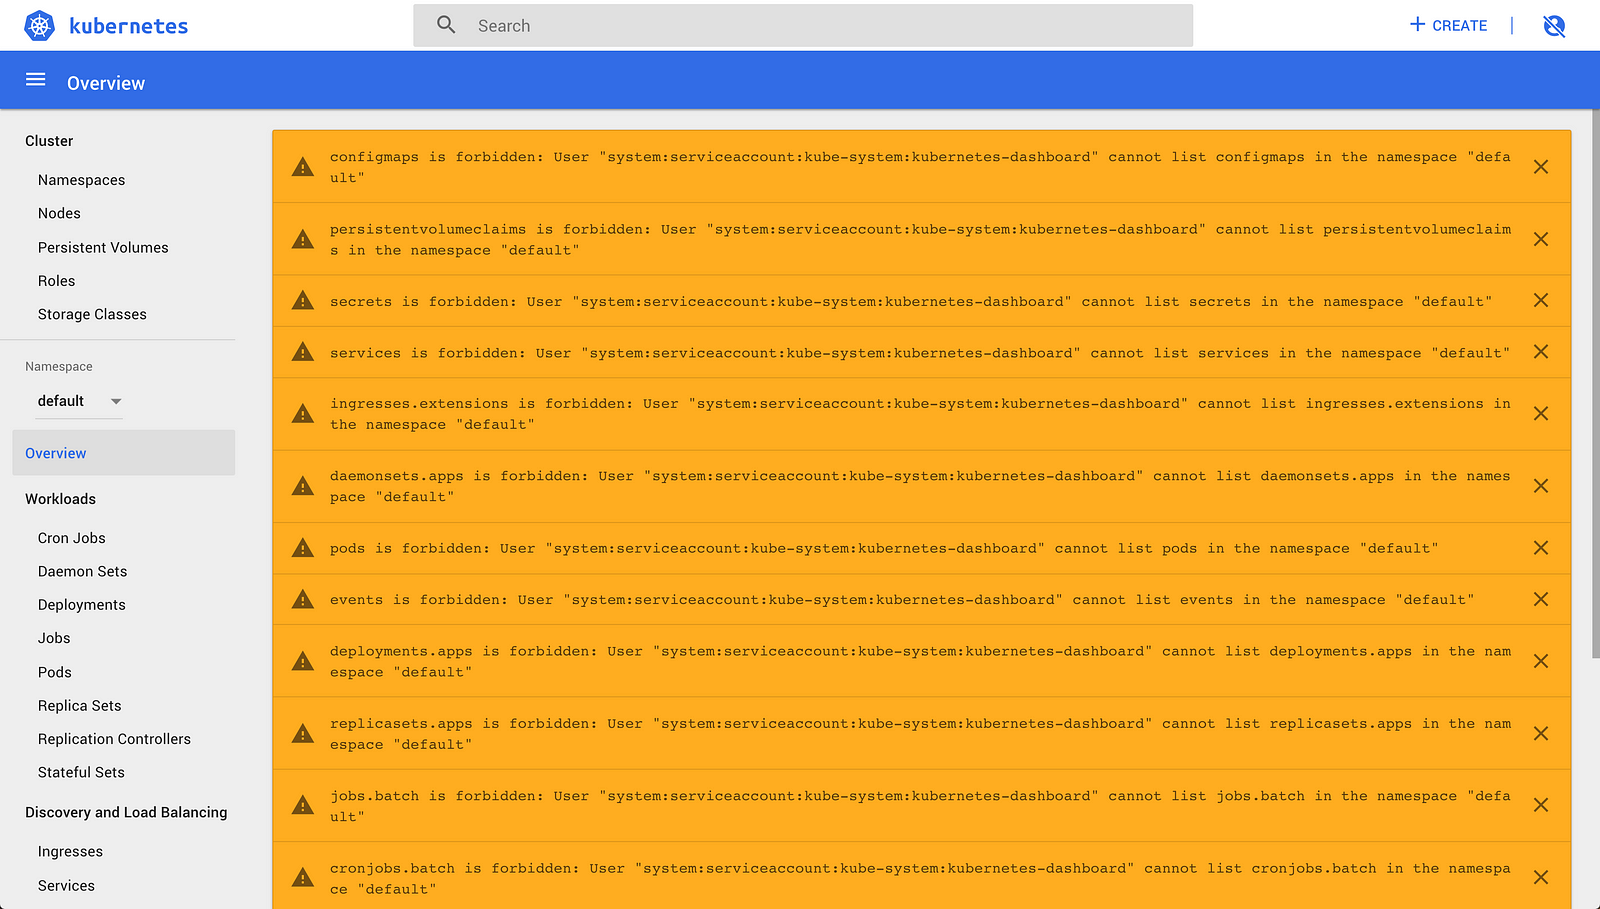
You should see a lot of errors if you skip the sign in dialog such as:
configmaps is forbidden: User "system:serviceaccount:kube-system:kubernetes-dashboard" cannot list configmaps in the namespace "default"
persistentvolumeclaims is forbidden: User "system:serviceaccount:kube-system:kubernetes-dashboard" cannot list persistentvolumeclaims in the namespace "default"
But we will fix that.
The following will create a service account in the default namespace and make a clusterrolebinding to allow you to use the dashboard.
$ kubectl create serviceaccount dashboard -n default
serviceaccount "dashboard" created
$ kubectl create clusterrolebinding dashboard-admin -n default
  --clusterrole=cluster-admin
  --serviceaccount=default:dashboard
clusterrolebinding "dashboard-admin" created
Read more about the clusterrole and its finer-grained options from the documentation. Your could e.g. make a view or edit clusterrolebinding for readonly access or users who aren’t allowed to change roles and rolebindings.
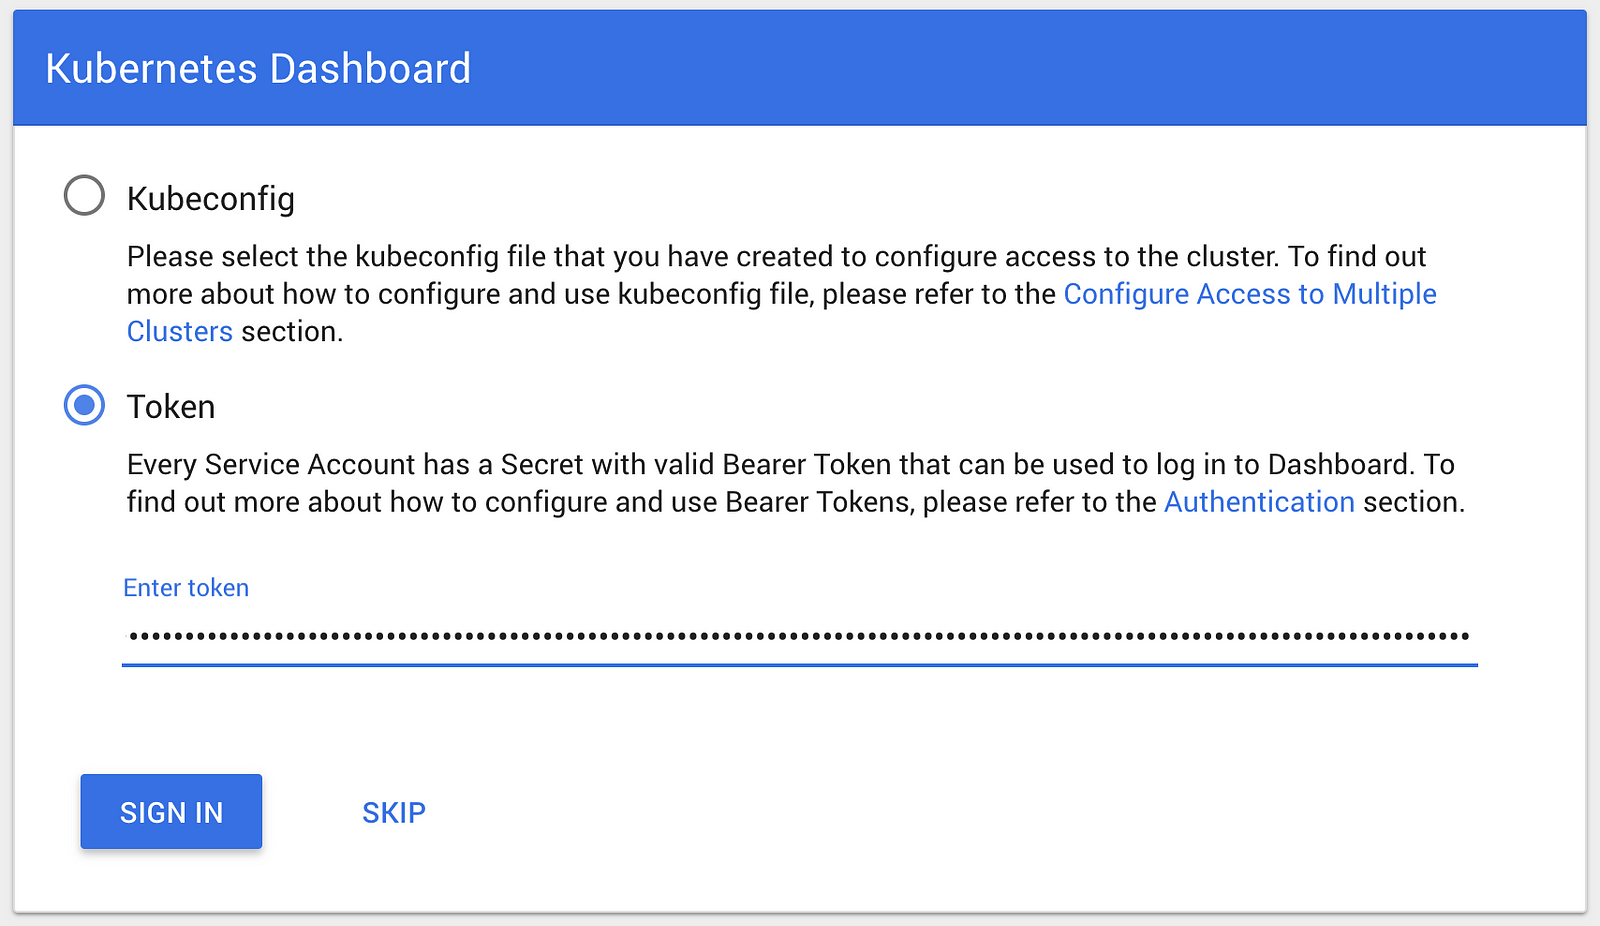
The following command outputs the token of your serviceaccount in a format ready to be copied into the sign in dialog by entering the outputted token (the trailing ‘%’ is NOT a part of the token).
$ kubectl get secret $(kubectl get serviceaccount dashboard -o jsonpath="{.secrets[0].name}") -o jsonpath="{.data.token}" | base64 --decode
eyJhbGciOiJSUzI1NiIsInR5cCI6IkpXVCJ9.eyJpc3MiOiJrdWJlcm5ldGVzL3NlcnZpY2VhY2NvdW50Iiwia3ViZXJuZXRlcy5pby9zZXJ2aWNlYWNjb3VudC9uYW1lc3BhY2UiOiJkZWZhdWx0Iiwia3ViZXJuZXRlcy5pby9zZXJ2aWNlYWNjb3VudC9zZWNyZXQubmFtZSI6ImRhc2hib2FyZC10b2tlbi03ZHB2MiIsImt1YmVybmV0ZXMuaW8vc2VydmljZWFjY291bnQvc2VydmljZS1hY2NvdW50Lm5hbWUiOiJkYXNoYm9hcmQiLCJrdWJlcm5ldGVzLmlvL3NlcnZpY2VhY2NvdW50L3NlcnZpY2UtYWNjb3VudC51aWQiOiJiYTVmNDlhZi0xMDM4LTExZTgtYTc1ZS1iODI3ZWI5ZmU3ZGIiLCJzdWIiOiJzeXN0ZW06c2VydmljZWFjY291bnQ6ZGVmYXVsdDpkYXNoYm9hcmQifQ.wDEn348dWbIGFFXx1dujn2nksJk607UrmVfXomPPwjH22idq0ktoy65UlQYQyHW5igsP36eoyJF3fWAsC-URaMZ8bGIDKV9at4Lt0BrKSAr9V3eD0dE7uIvtyZrbT7_BERGB-RTZhXMa1WUTWeuvwWLBzCxIUClDhub9c9CAPmsaU3OrdzF9aGW8LV6F-4ALYAhpr48ez-0PpjofTPEr_x4luDd37Owi8oUffzFoaZhjVCoUP4MjERN8zMSlAPm6GLYbxWWSsI_WZ-fix2gY6iHfWeHskSIWz77yNx9pnxcPBfA6zpyU8_Q5tJ3j3G6Vv4TLEikFV8FqsLI0WqAWYw%The command consists of multiple parts in order to make it easy to get the token, which will be explained in the end of the post.
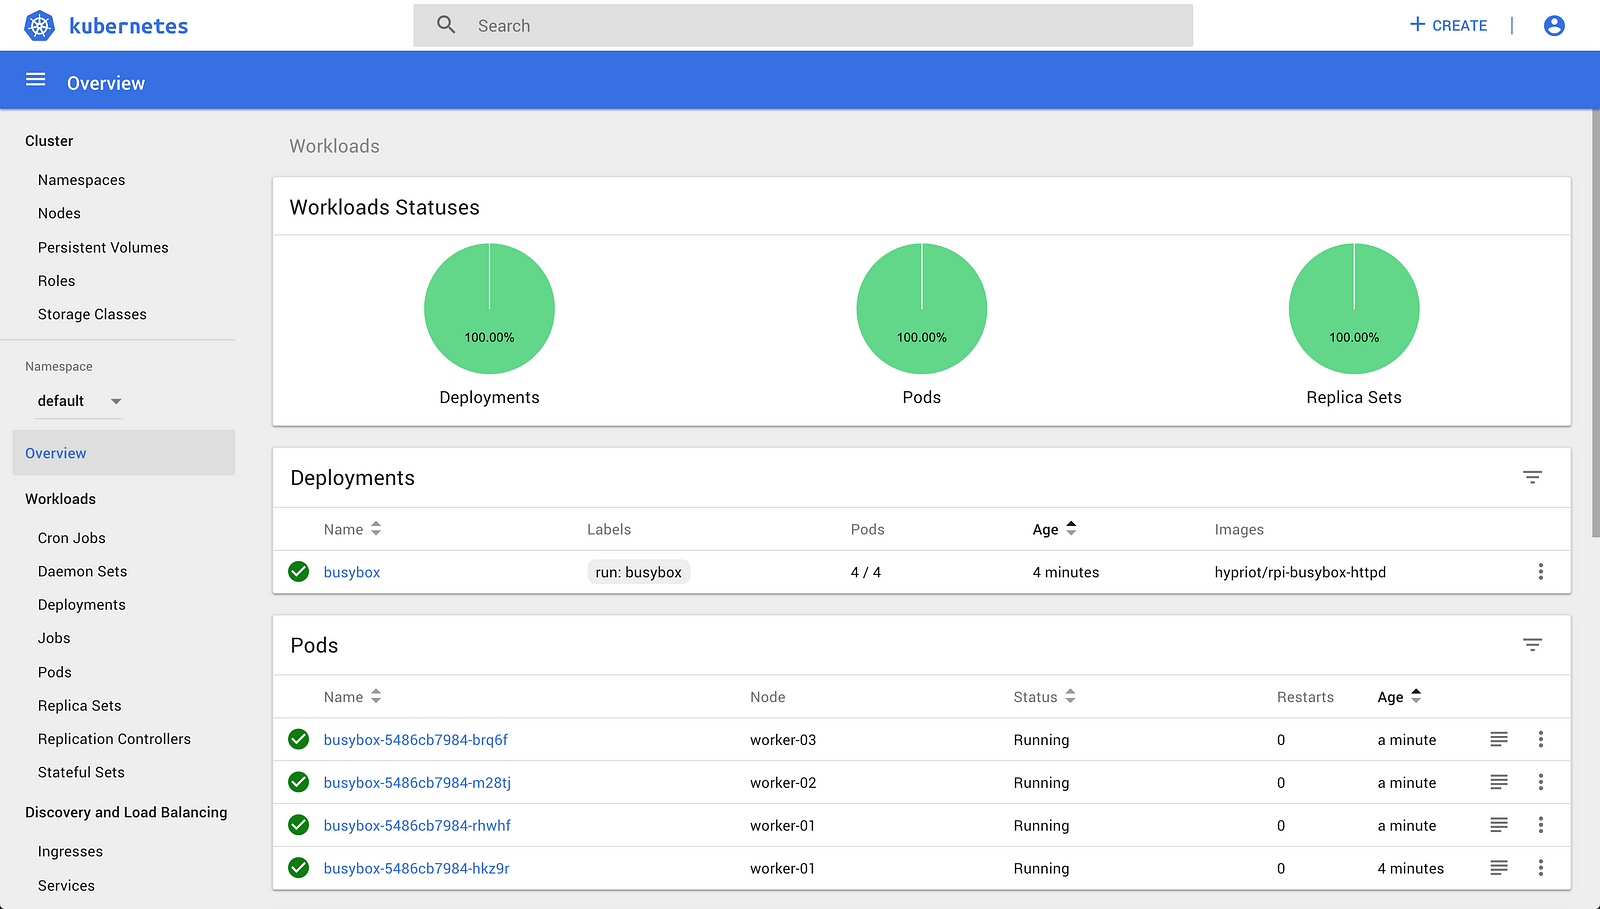
Now the dashboard is able to perform requests without filling your screen with permission errors. For a local cluster cluster-admin is fine, I would though consider using the more restricted roles for other use cases. The editrole seems to have most of what the dashboard needs from my poking around.
Command explanation
The token is located in a secret that belongs to a service account. Furthermore, it is encoded as base64, which is how Kubernetes does with secrets.
$ kubectl get secret $(kubectl get serviceaccount dashboard -o jsonpath="{.secrets[0].name}") -o jsonpath="{.data.token}" | base64 --decodeThe first command finds the secretname of the secret by printing its name from the service account’s jsonpath. This is substituted in the full command.
$ kubectl get serviceaccount dashboard -o jsonpath="{.secrets[0].name}"The outer command prints the base64 token using its jsonpath in the secret.
$ kubectl get secret secretname -o jsonpath="{.data.token}"The last part pipes the base64 encoded token into a decoder that outputs the token.
... | base64 --decode
This article originated from http://kubecloud.io/kubernetes-dashboard-on-arm-with-rbac-61309310a640
Martin Jensen is a Tigera guest blogger and is a Web Architect at Lunar Way.
————————————————-
Free Online Training
Access Live and On-Demand Kubernetes Tutorials
Calico Enterprise – Free Trial
Solve Common Kubernetes Roadblocks and Advance Your Enterprise Adoption