In my previous blog post, I discussed how transitioning from legacy monolithic applications to microservices based applications running on Kubernetes brings a range of benefits, but that it also increases the application’s attack surface. I zoomed in on creating security policies to harden the distributed microservice application, but another key challenge this transition brings is observing and monitoring the workload communication and known and unknown security gaps.
In a more traditional application architecture, traffic will flow between tiers of an application and will usually traverse a firewall, and at that point, can be observed and actioned. In Kubernetes, the network architecture is much flatter, and thus creates a challenge for the more traditional means of observing flows in the cluster.
However since Calico is able to secure workloads on this flat network, it also means it can observe these traffic flows, too. In fact, Calico can report far more data about these flows over what a traditional 5-tuple firewall would, allowing DevOps and Security teams to make more informed decisions to effectively secure their applications.
Calico’s 52 data types
Traditional firewalls will report on five data types, or tuples, of a flow. Namely:
- The source IP address
- The destination IP address
- The source port
- The destination port
- The protocol
To allow DevOps and security teams to make fully informed decisions, Calico reports on 52 data types. These data types can be seen in Calico flow logs, in the Dynamic Service and Threat graph, and in Kibana:

Important data types
Now, data is only useful if it is understood, and 52 data types is a lot to ingest in one go, so in this blog, we will aim to cover only data types you need to understand when observing a flow.
| Name | Description |
| action | This is the action that Calico took on the flow.
|
| source_name_aggr / dest_name_aggr | Contains one of the following values:
|
| source_namespace / dest_namespace | This is the namespace of the source or destination endpoint. If you see a dash – , this means the endpoint is not namespaced (for example a Host Endpoint or a Global NetworkSet) |
| source_type / dest_type | This is the source or destination endpoint type. Possible values:
|
| dest_port | Destination port. Not applicable for ICMP packets |
| reporter |
|
| proto | Protocol such as UDP or TCP |
| policies | The policy or policies that allowed, denied or passed this flow. Staged policy names are prefixed with “staged:” |
Sample flow
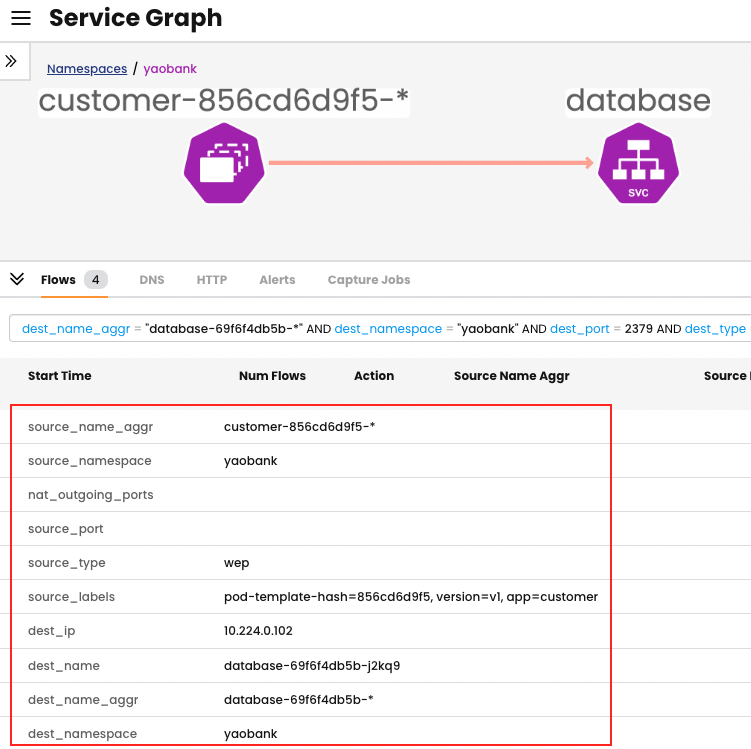
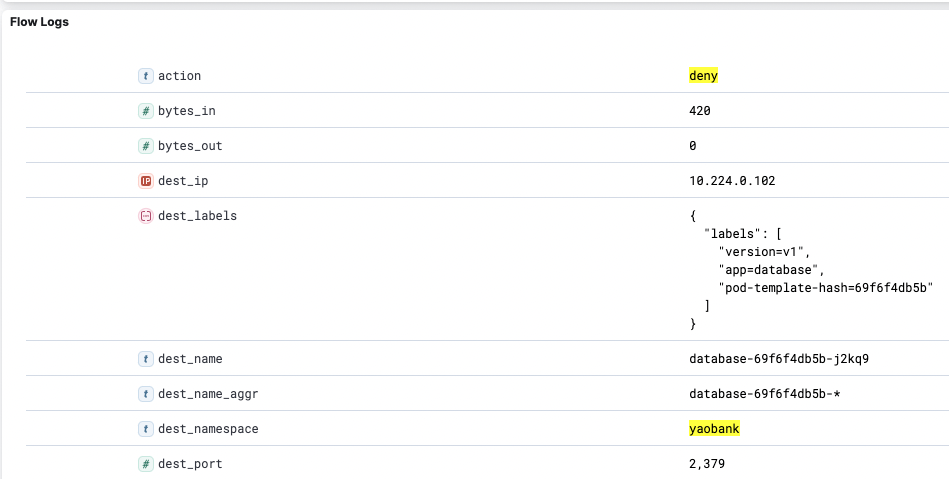
To fully understand how these data types are read, let us take a look at a sample flow where a front-end pod named customer is trying to communicate with a pod named database.
An abridged version of the flow logs, with only the fundamental data types present, is shown below:
"source_name_aggr": "customer-856cd6d9f5-*",
 "source_namespace": "yaobank",
 "source_type": "wep",
 "dest_name_aggr": "database-69f6f4db5b-*",
 "dest_namespace": "yaobank",
 "dest_port": 2379,
 "dest_type": "wep",
 "proto": "tcp",
 "action": "deny",
 "reporter": "src",
 "policies": {
   "all_policies": [
     "3|application|yaobank/application.allow-customer|deny|-1",
     "0|tigera-security|tigera-security.block-alienvault-ipthreatfeed|pass|1",
     "1|security|security.security-default-pass|pass|0",
     "2|platform|platform.platform-default-pass|pass|0"
   ]
 }
From this snippet we can ascertain that:
- Traffic was flowing between customer-856cd6d9f5-* and database-69f6f4db5b-*
- Traffic was all within the yaobank namespace
- Traffic was denied in an egress direction
- Based on “action”: “deny” and “reporter”: “src”
- Traffic was based on TCP port 2379
- The last policy to action the traffic was called allow-customer
Reading the policies data type
You may ask, how did we determine what policy actioned the traffic last? One of the most important data types is policies but it can also be difficult to read. You can decode each entry in the policy data type as such:
{order this policy processed the traffic}|{tier name}|{policy name}|{action}|{rule number that took action}
By decoding the policies flow log, we can determine:
- Traffic first hit the tigera-security tier: 0|tigera-security
- Inside the tigera-security tier the endpoint was scoped by the block-alienvault-ipthreatfeed policy: |tigera-security.block-alienvault-ipthreatfeed
- This policy passed the traffic: |pass
- This action was taken by the second rule: |1
- The second tier that scoped the endpoint was the security tier: 1|security
- Inside the security tier the traffic was scoped by the security-default-pass policy: |security.security-default-pass
- This policy passed the traffic: |pass
- This action was taken by the first rule: |0
- The third tier that scoped the endpoint was the platform tier: 2|platform
- Inside the platform tier the traffic was scoped by the platform-default-pass policy: |platform.platform-default-pass
- This policy passed the traffic: |pass
- This action was taken by the first rule: |0
- The fourth tier that scoped the endpoint was the application tier: 3|application
- Inside the application tier the traffic was scoped by a namespaced policy named allow-customer: |yaobank/application.allow-customer
- The policy denied the traffic: |deny
- This action was taken by an implicit deny: |-1
Conclusion
In Kubernetes, observability is a required tool for the DevOps and security teams to perform their tasks effectively, and to troubleshoot efficiently. Regardless of the underlying infrastructure, Calico Enterprise reports on a rich set of data types that provides full visibility into the flows present in your cluster.
Ready to try an observability-as-code approach for yourself? Get started with a free Calico Cloud trial.
Join our mailing list
Get updates on blog posts, workshops, certification programs, new releases, and more!