Today, the cloud platform engineers are facing new challenges when running cloud native applications. Those applications are designed, deployed, maintained and monitored unlike traditional monolithic applications they are used to working with.
Cloud native applications are designed and built to exploit the scale, elasticity, resiliency, and flexibility the cloud provides. They are a group of micro-services that are run in containers within a Kubernetes cluster and they all talk to each other. It can quickly become overwhelming for any cloud engineer to understand and visualize their environment.
Visualizing Kubernetes network traffic and service dependencies presents significant challenges due to the dynamic and distributed nature of Kubernetes environments. The dynamic nature of Kubernetes clusters, with frequent scaling of pods, creation and deletion of services, and changes in network connections, makes it difficult to capture an accurate and up-to-date representation of network traffic and service dependencies.
Additionally, the complexity of Kubernetes networking, involving multiple components such as pods, services, and network policies, further complicates the visualization of network traffic flow and understanding of service dependencies. The use of microservices architecture in Kubernetes, where applications consist of interconnected services, adds to the complexity, particularly as the number of services grows.
Moreover, the scalability and distributed nature of Kubernetes clusters, spanning numerous nodes and pods across physical or virtual machines, pose challenges in visualizing network traffic and service dependencies due to the scale and intricacy of the infrastructure.
Lastly, although Kubernetes offers basic metrics and logging capabilities, its built-in visibility and observability features for network traffic are limited, making it inadequate for obtaining a comprehensive view of network traffic and service dependencies.
In this blog post, we will focus on graph-based visualization of Calico Cloud Dynamic Service and Threat Graph and how it can help not only Security Engineers, DevOps, Cloud Engineers and Developers but also team managers that don’t necessarily need/have a huge Kubernetes background but still need to know what is going on in their company’s clusters.
Cloud native applications
Before we start talking about Dynamic Service and Threat Graph, I would like to explain a little bit about what a Cloud Native Application is and how it uses microservices to work.
Monolithic to Web Applications
Traditionally, applications were installed as monolithic applications in servers. Eventually, these applications have been decomposed into smaller functions and installed on multiple servers. We are familiar with the notions of Frontend, Backend, Load Balancers etc. A web application can now be installed on multiple cloud instances for scalability and reliability; both instances would use the same database or a high availability database and the end users would be able to automatically connect to the fastest instance through a load balancer.
From web application to microservices-based application
In Kubernetes, the applications are broken down into microservices. It is a new type of architecture model where the application is composed of multiple lightweight applications working together through API, events, etc.
Consequently, each lightweight application is containerised and will have multiple benefits such as scalability, redundancy, reliability, ease to patch/fix a portion of the whole application, or simply easy to automate a new deployment.
Some of the drawbacks of that architecture are that a single application may now use much more network communications, and will be deployed in multiple pods and nodes. Being secure, compliant and well configured will also be a challenge. And most importantly, you will need new teams, new skills, new processes and especially new tools for your teams to work together frictionlessly.
Example: Cloud-native application, Boutique
Below is an application based on microservices that is called “Boutique”.
That application was designed by Google and is readily available for everyone who wants to work with cloud native applications and Kubernetes.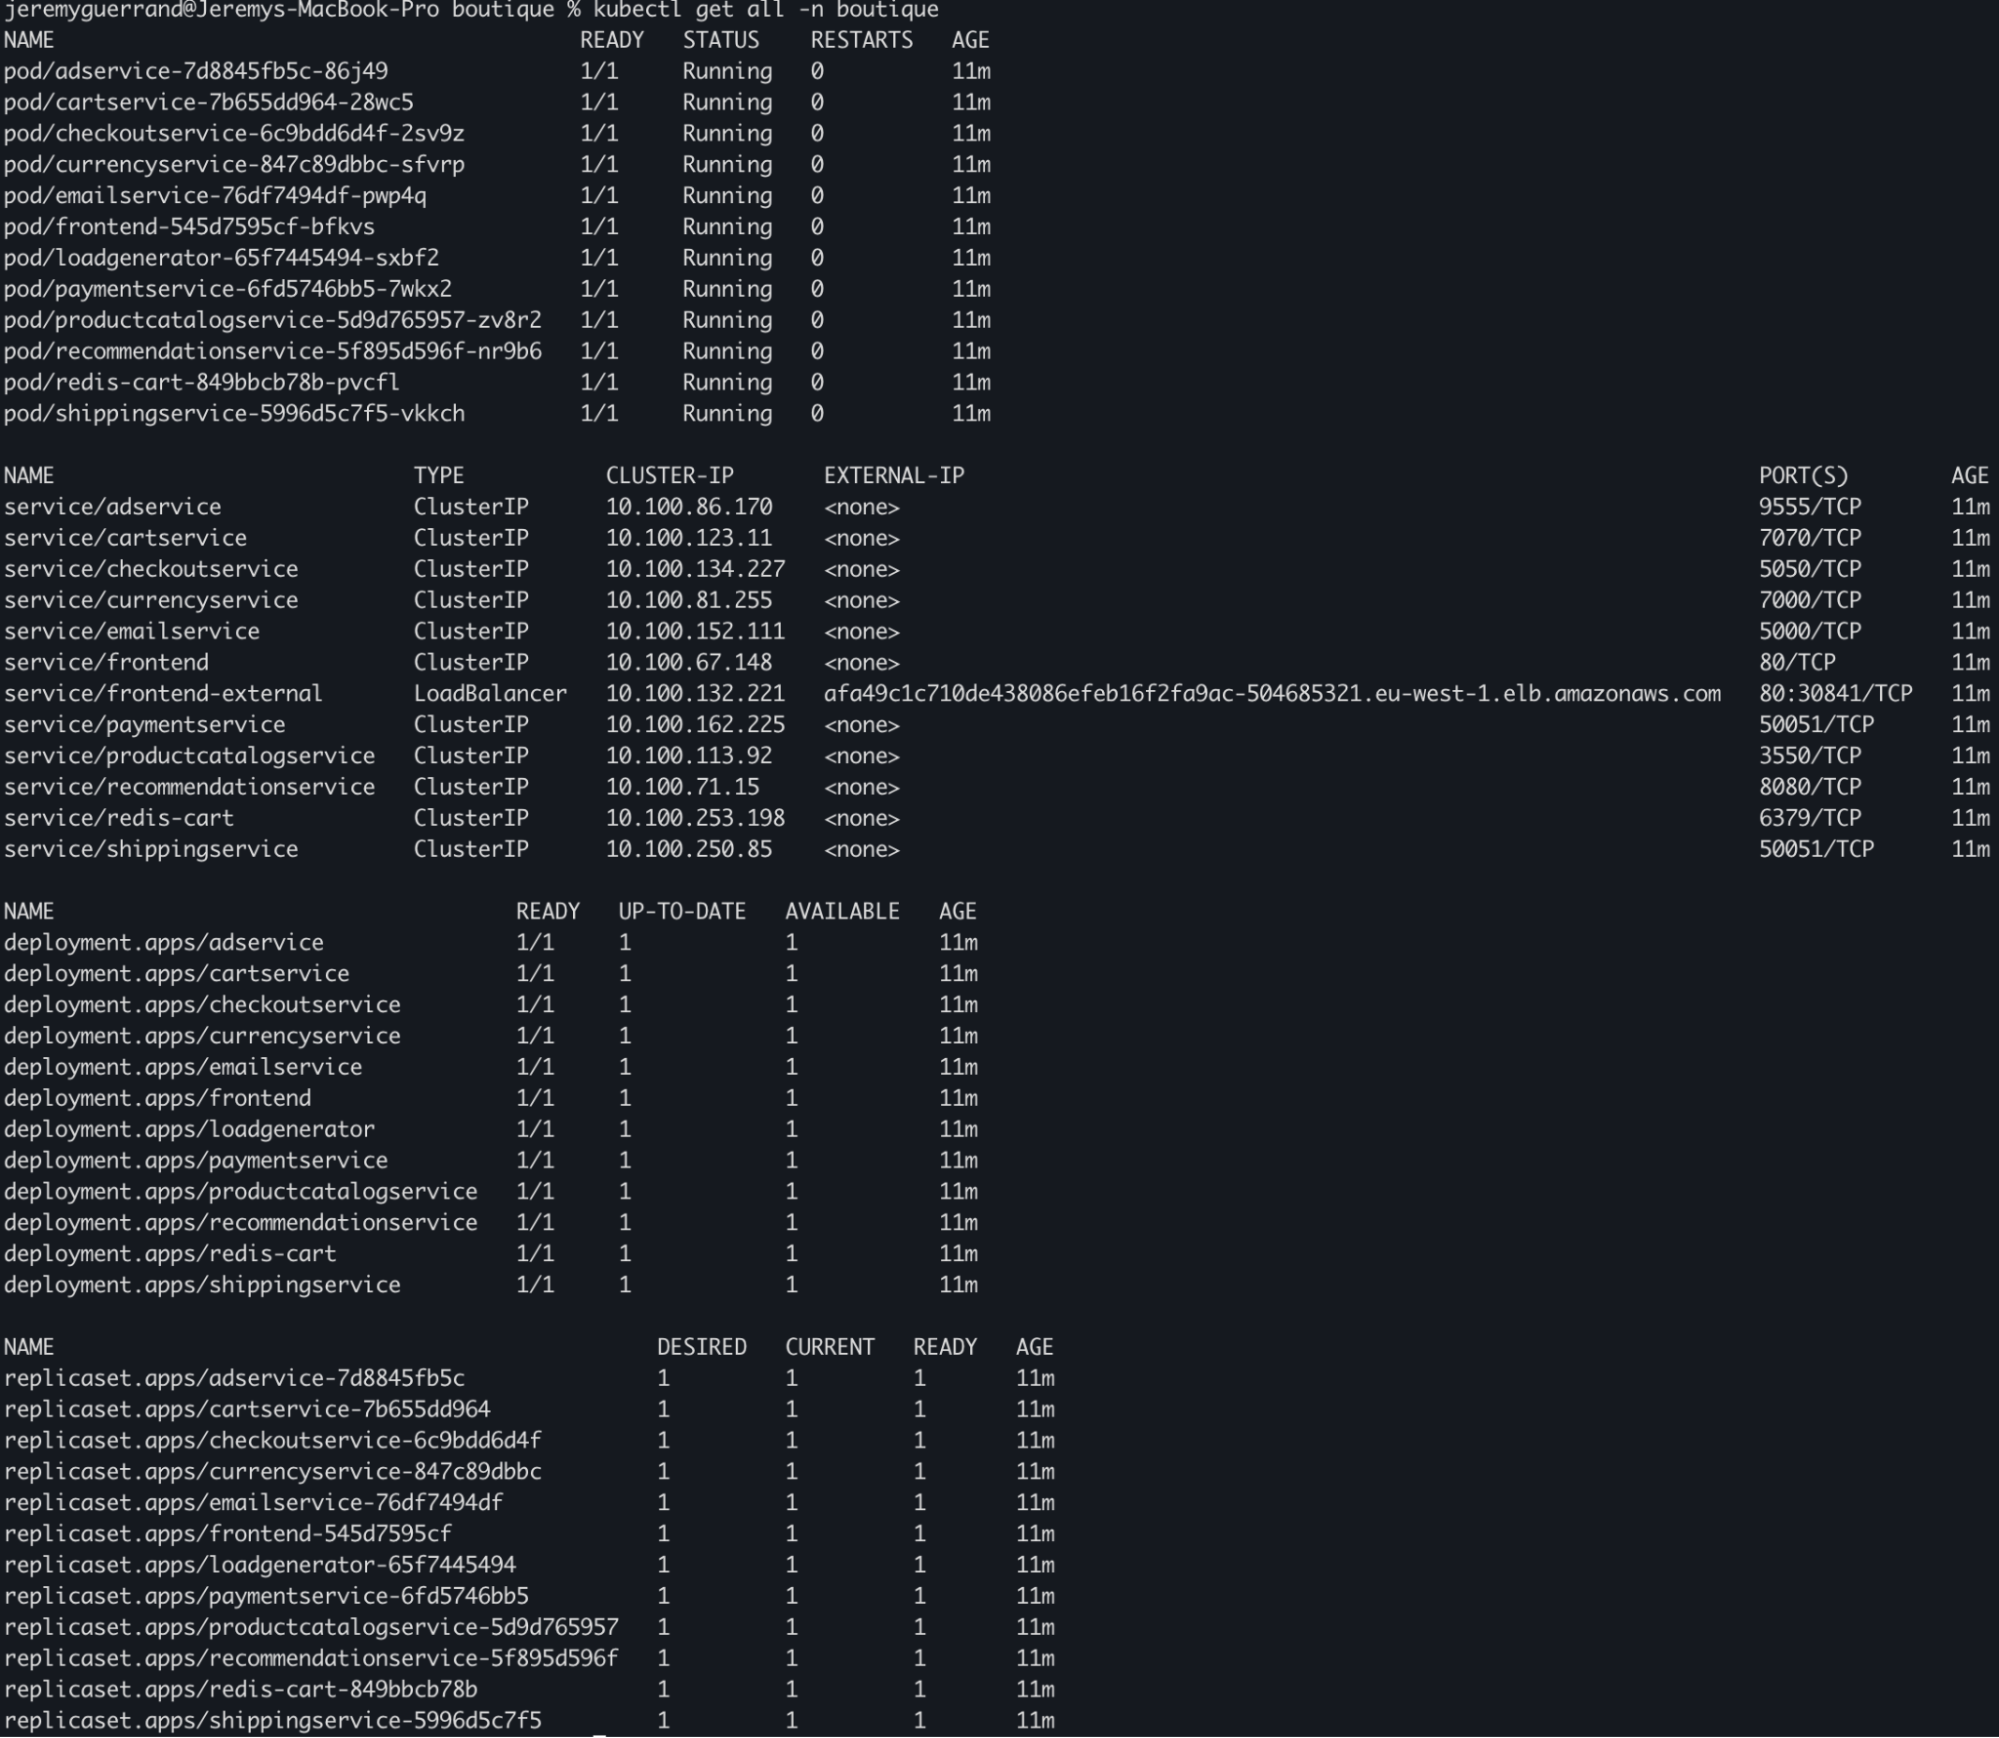
As you can see, working with Kubernetes can be difficult, it is not a user friendly place where non Kubernetes skilled people can find information easily. On top of that, we lack information about the relationship between services. We don’t really know who is talking who, where, how, when and so on. Only the developers and perhaps the DevOps will know about the applications foundations by opening the yaml manifest and reading into numerous lines of code.
Why you need Calico’s Dynamic Service and Threat Graph
If you are a Kubernetes System, Network or Security engineer or simply a Team Leader/Manager, you will find it difficult to work with so little information, especially when you deal with multiple clusters and hundreds of applications.
There exist tools out there that will display those information in a GUI but again you will lack information about networking, security, relationship between services. It would more or less be the same information as the CLI but in a more user friendly way.
This is where Dynamic Service and Threat Graph shines.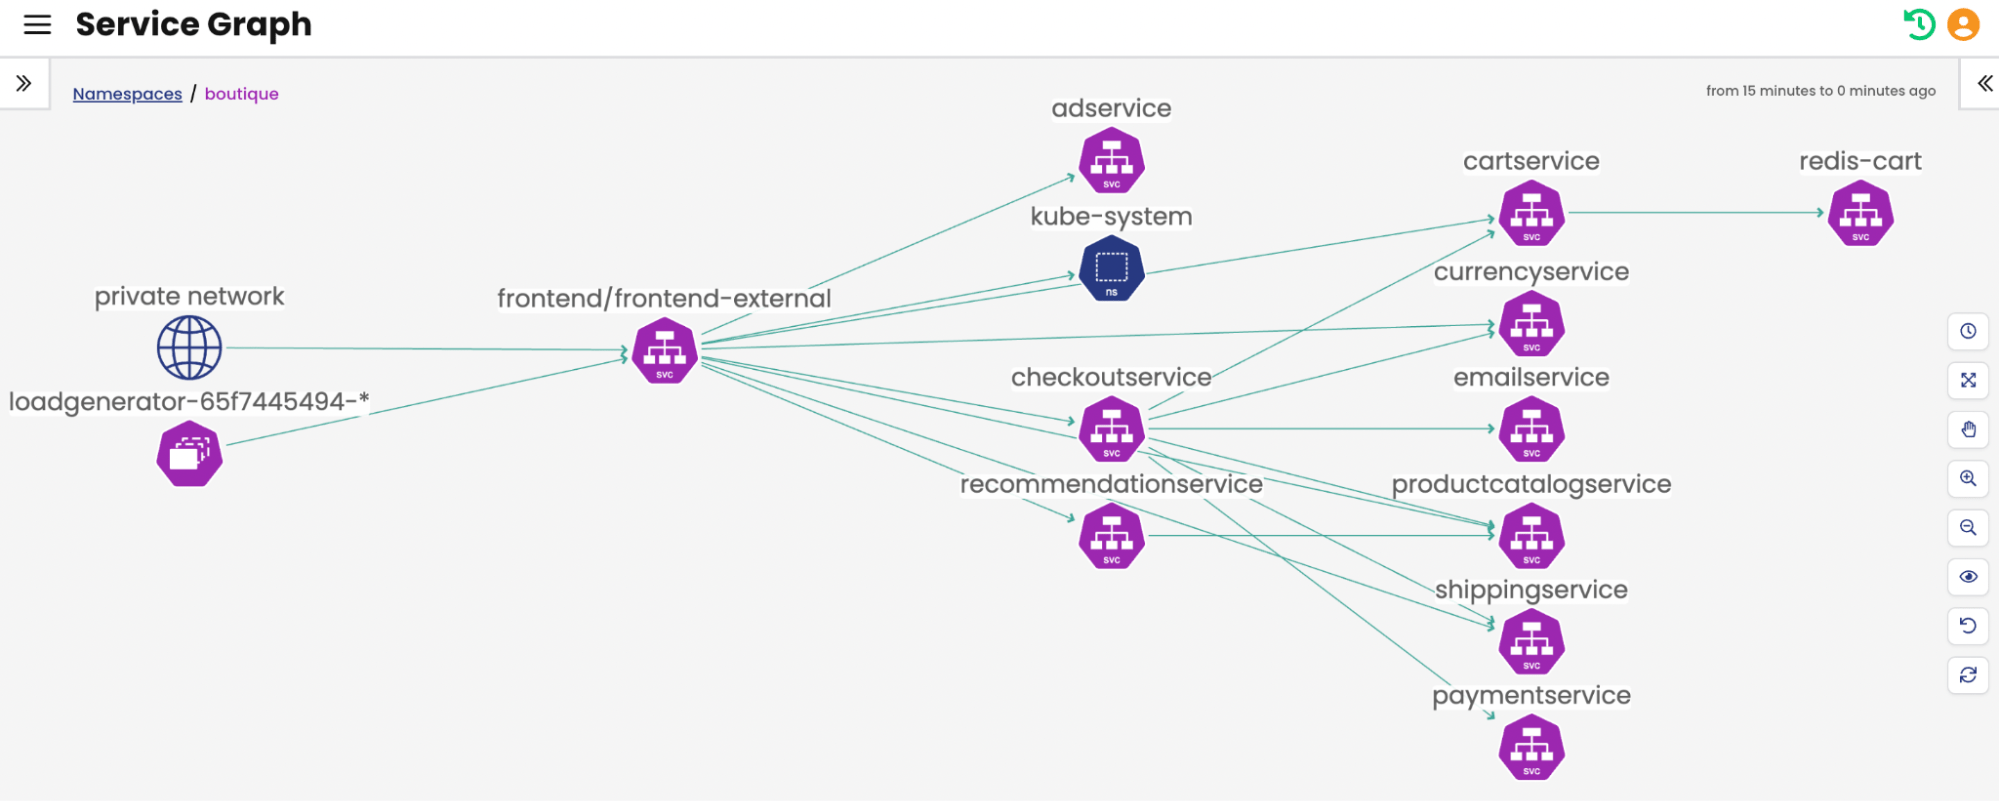
In about a second you will be able to display your applications and break it down at the microservice level. Any person that is not necessarily a K8s expert will understand how this application is structured and how each microservice is interacting with each other.
DevOps or DevSecOps engineers that are aware of the application can quickly identify anomalies like misconfigurations in Policies or communications between services that should not exist or that are sporadic or simply overflowing.
The Dynamic Service and Threat Graph also features a zoom in and out option where you can see your namespaces and how they interact with each other, which makes it very easy to identify legit lateral movements from your workloads and build adequate policies or identify denied lateral movements and start investigating the issue.
Below is the Boutique application where you can see the services and their pods: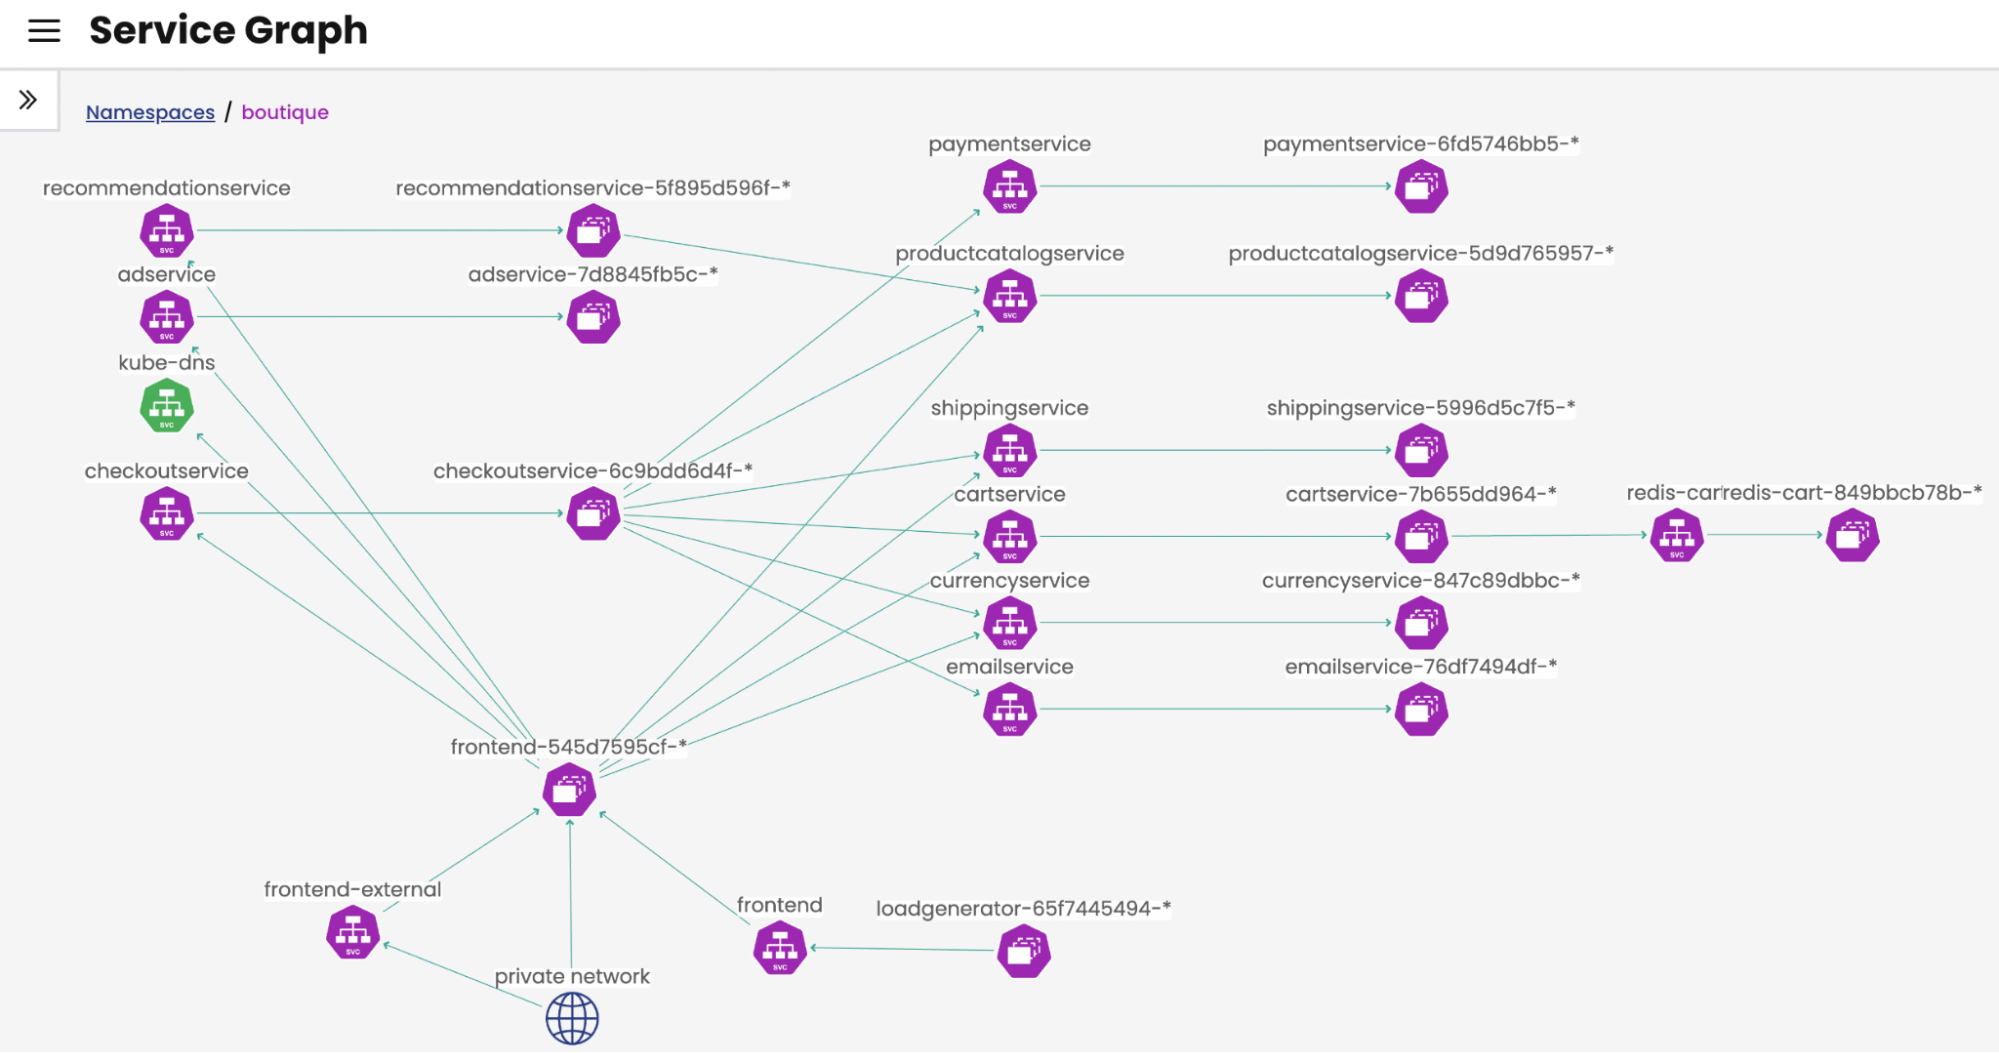
Using the zoom in function will drill down to the service to pod relationship which can be a great tool for troubleshooting problems or performance issues. It means that your Platform engineer will be able to identify problems (performance, security, anomaly or production down) very efficiently and will be able to contact the appropriate team in a timely manner. This creates a frictionless environment for your teams to work together.
Below is another example of where you can see an application that you may not be familiar with and is having issues. In just a few seconds and clicks you will notice that one of your pods is contacting a malicious address that is registered in our Threat Feed protection feature. That feature will deny the communication as you can see by the red edge and also notify you with the red flag (alert).
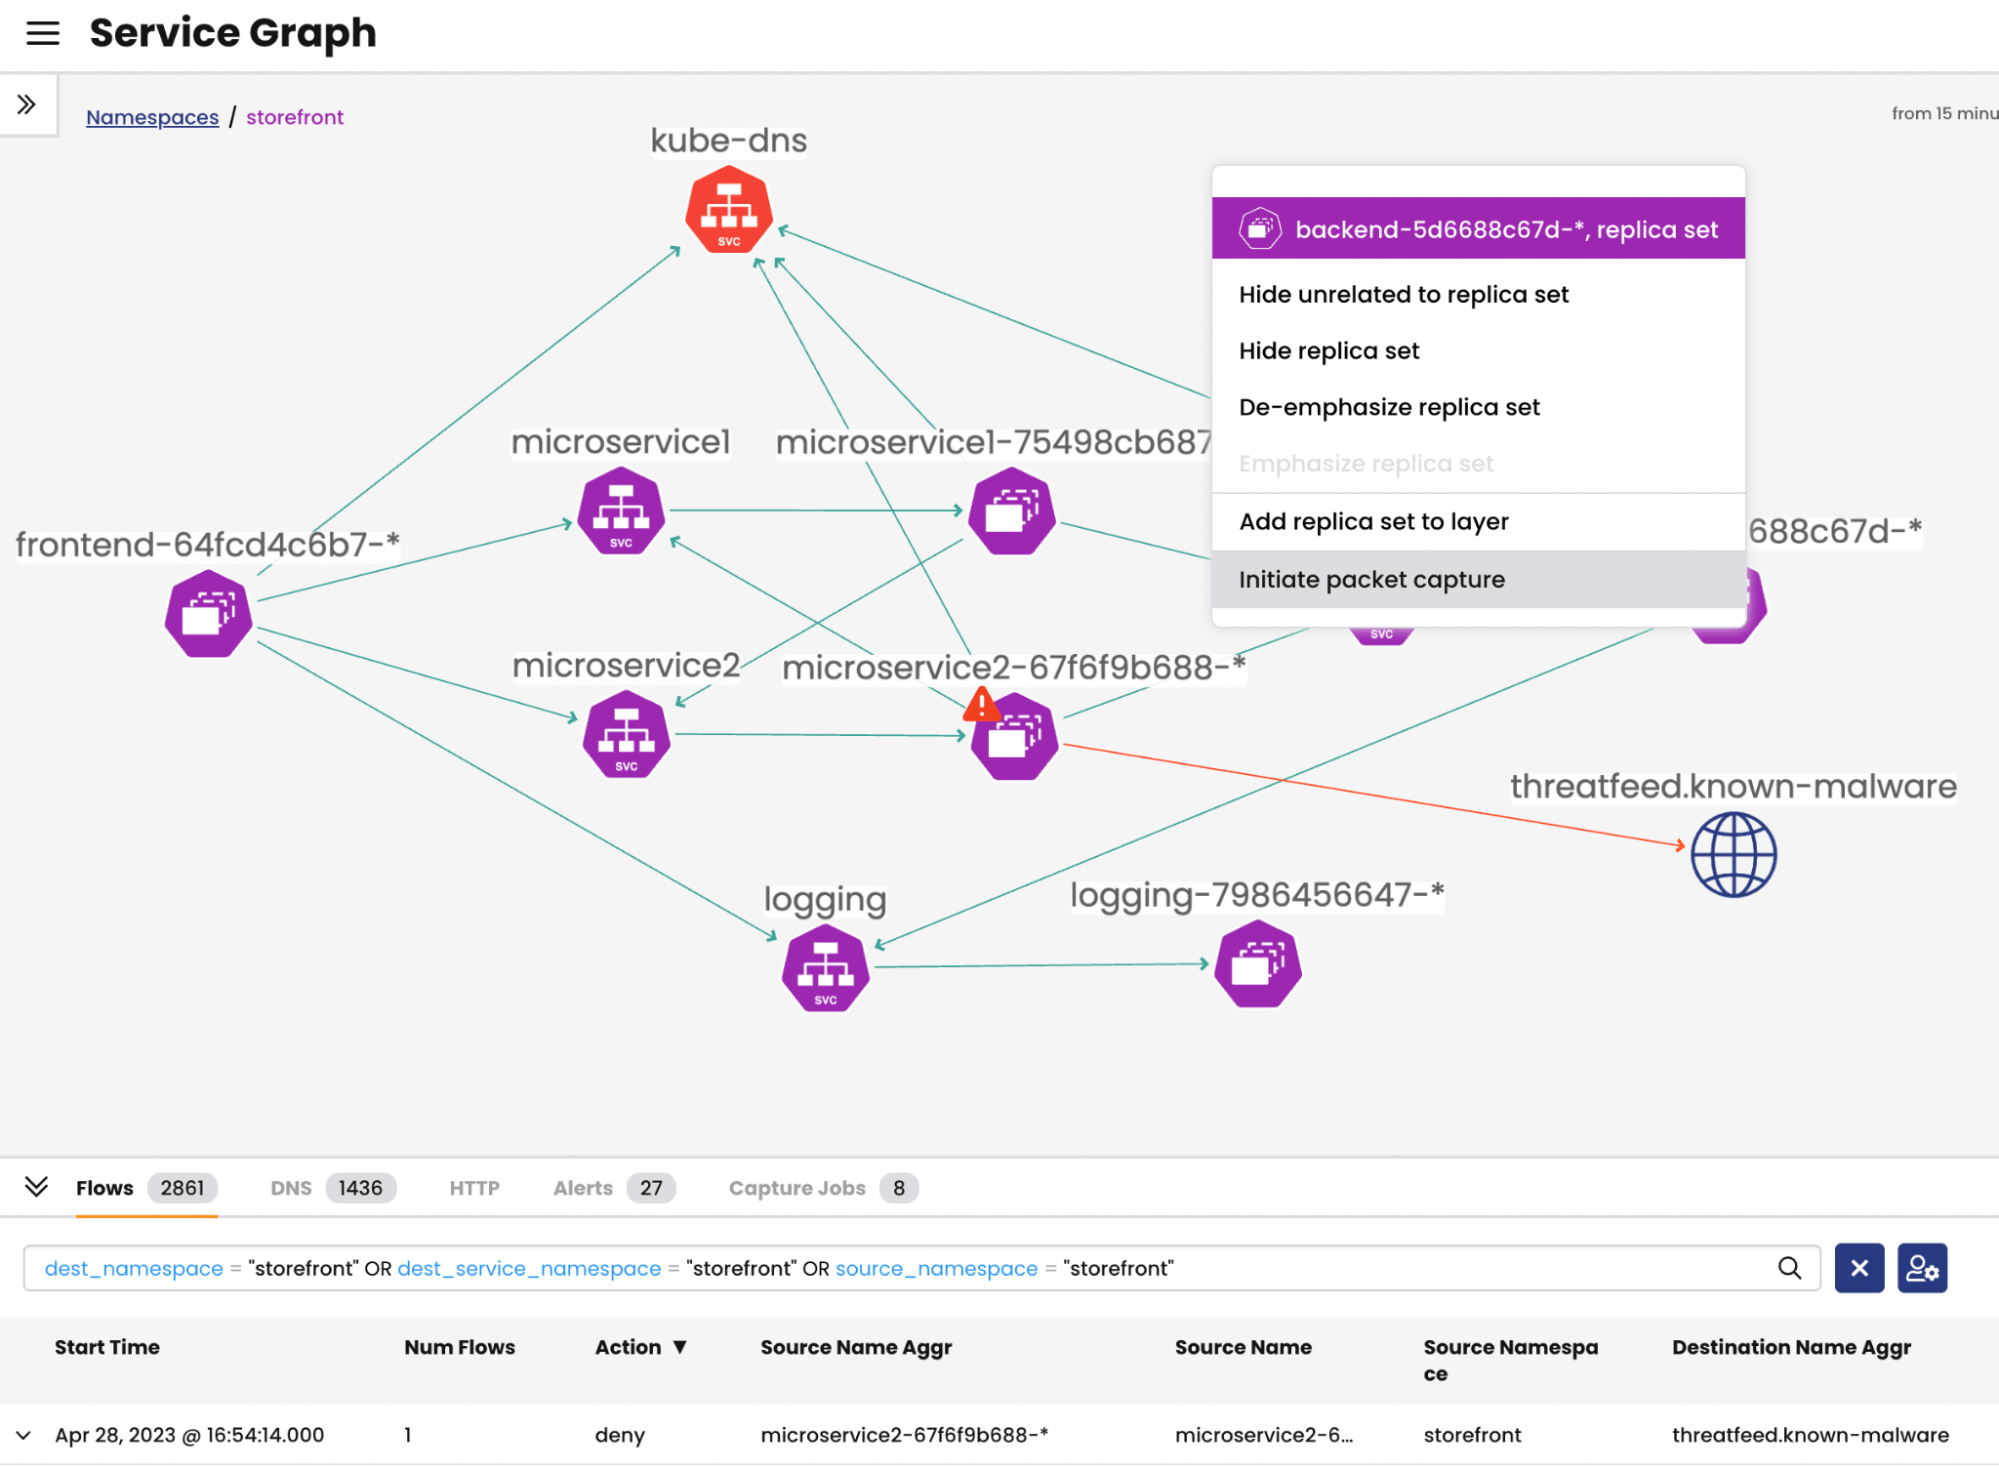
If you look below the Service Graph, at the bottom of the page you will see multiple tabs: Flowlogs, DNS, HTTP, Alerts, and Capture Jobs.
This is where the Service Graphs will give you everything you need to know about your applications. You will be able to see your flows and sort them by action (deny, allow) and see all the metadata from source to destination i.e. you will see labels, addresses, protocols, policies etc.
Calico Enterprise and Calico Cloud also offer Layer 7 visibility which means you will be able to see attacks like SQL Injection for instance. The last tab is where you can download your packet capture in PCAP format directly to your computer which will help the K8s engineers to work with the regular network teams too.
Conclusion
Dynamic Service and Threat Graph enables IT professionals to work with Kubernetes. Whatever your role, skills and experience, it will always help you and your teams in your Kubernetes journey. Could it be for Networking, Security, and the production in general, it will save you headaches and time when looking for specific data and logs; moreover it will optimize how teams are cooperating with each other and create a frictionless environment.
The transition to cloud native applications has already started and major companies have already started their transition years ago. We are now entering into the early massive adoption period and most of the businesses do not necessarily have the resources to hire skilled engineers hence they will have to rely on their existing teams. Having a plug-n-play and easy to use solution that facilitates the transition and enables your workforce will be the key to success in your Kubernetes journey.
Want to learn more? Get started with a free Calico Cloud trial.
Join our mailing list
Get updates on blog posts, workshops, certification programs, new releases, and more!