DNS Dashboard

Quickly confirm or eliminate DNS as the root cause for microservice and application connectivity issues in Kubernetes

Overview

Kubernetes relies on DNS to enable service-to-service communication. DNS related intermittent delays, lookup failures, configuration issues can have a significant impact on application performance resulting in poor or unexpected customer experience. Calico’s DNS Dashboard observes and monitors traffic flows to look for DNS queries and replies, and generates a special set of DNS log data for activity within a cluster. It simplifies the troubleshooting process and speeds up problem resolution with an interactive UI displaying related DNS information categorized by microservices and workloads.

Benefits

  • Classify and view DNS codes by microservice
    Users can immediately gain insights for performance hotspots and troubleshooting connectivity issues, such as:
    • Which DNS servers are in use?
    • Who is making the queries?
    • What types of queries are being made?
    • What replies are they receiving? Are there errors?
    • How many queries of a particular service are being made?
    • What is the minimum, maximum, and average latency?
    • How much data was transmitted/received by a service or pod?
  • Auto-logging of all DNS activity
    All DNS activity with Kubernetes context is automatically logged as DNS log data. External queries to domains outside the purview of Kubernetes are also logged to provide a complete view of DNS activity.
  • Security and compliance
    Security teams can define and apply global alerts that are automatically triggered based on certain criteria using logged data. For example:
    • What DNS servers are being queried?
    • How much data is being transferred and received by each pod?
    • How many queries are being received?

Capabilities

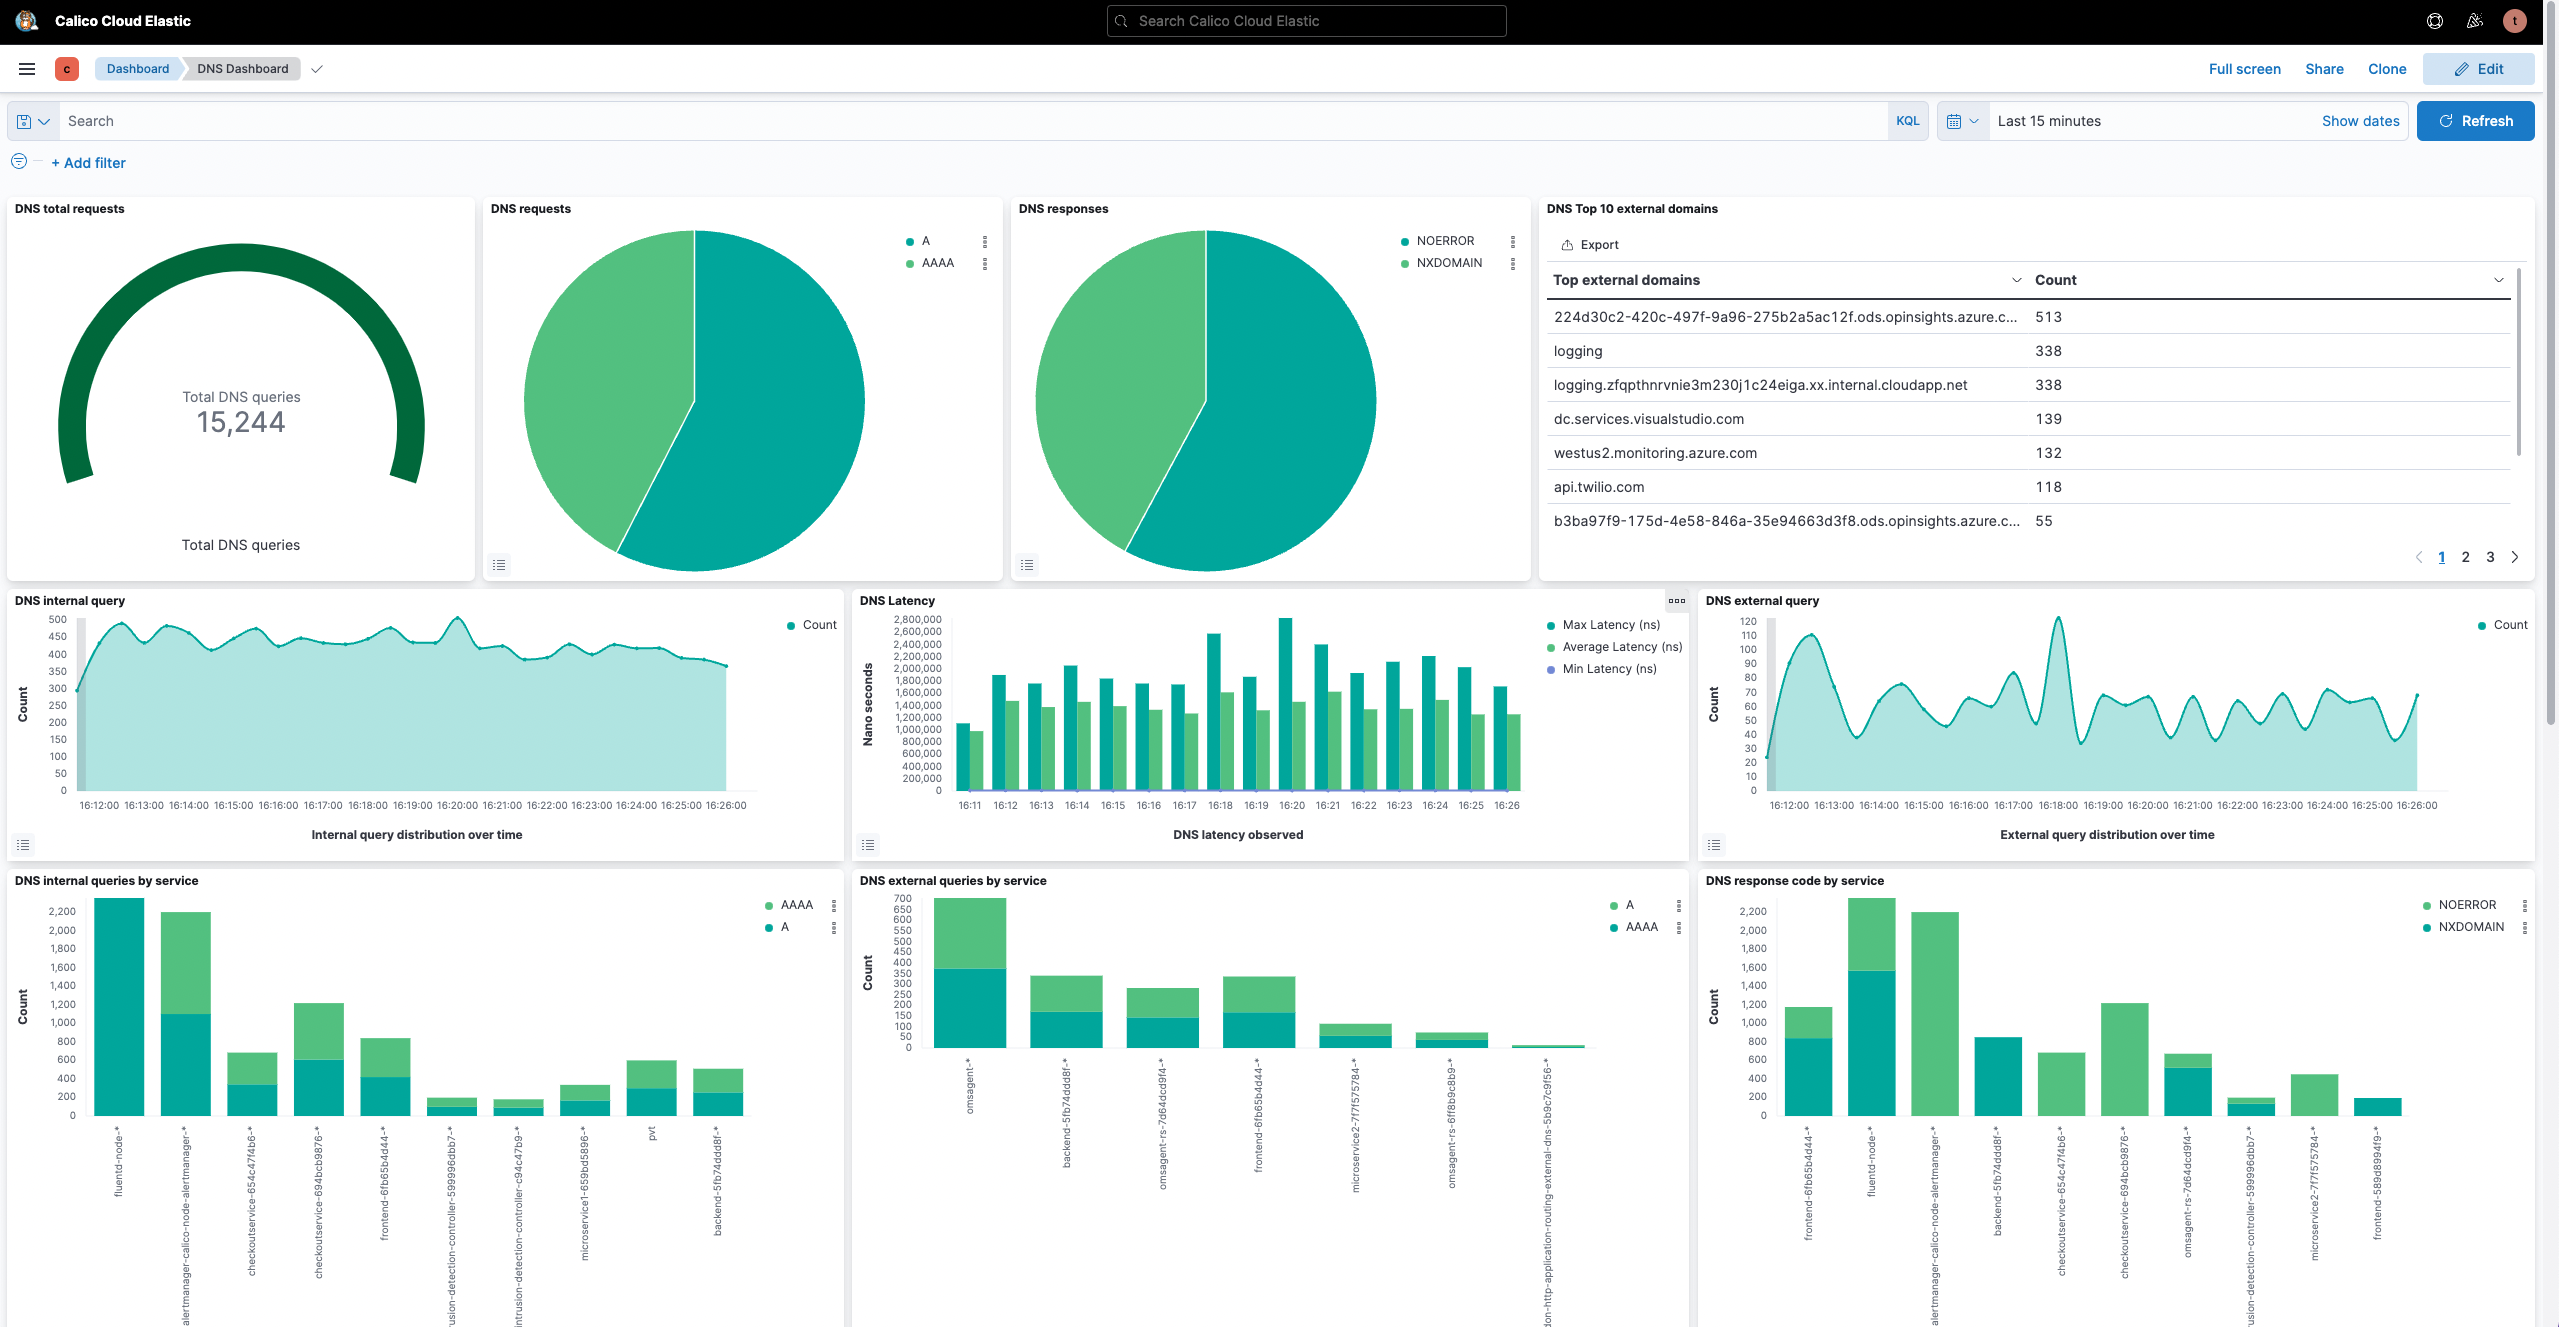
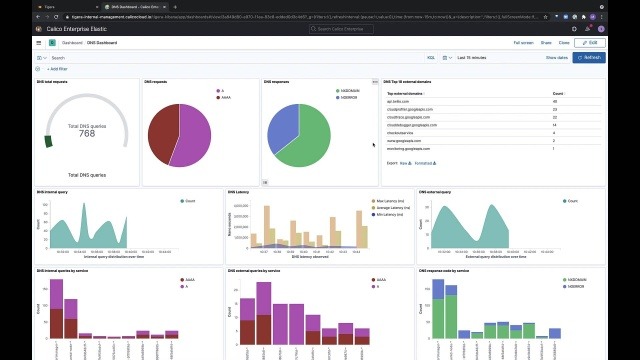
The DNS Dashboard based on Kibana is an interactive UI that can be used to:

  • View the total number of DNS queries and replies
  • Classify and view DNS codes by microservice
  • Classify queries and replies by record type (e.g. CNAME, A, AAAA, MX, SRV, etc.)
  • Determine the source of a query as a workload or microservice
  • Filter based on troubleshooting scenarios
  • Automatically log all DNS queries and replies

How It Works


Learn how Calico’s DNS Dashboard generates a special set of DNS log data for all Kubernetes activity, and can help you observe and monitor traffic flows to look for DNS queries and replies.

Resources

Webinar

Technical Blog

Calico Cloud Datasheet