In this blog post, I will be talking about audit and compliance and how to implement it with Calico. Most IT organizations are asked to meet some standard of compliance, whether internal or industry-specific. However organizations are not always provided with the guidance to implement it. Furthermore, when guidance has been provided, it is usually applicable to a more traditional and static environment and doesn’t address the dynamic nature of Kubernetes. Existing compliance tools that rely on periodic snapshots do not provide accurate assessments of Kubernetes workloads against your compliance standards.
Getting started with audit and compliance for Kubernetes clusters
A good starting point is understanding what type of compliance requirements needs to be enforced and confirming that the enforcement is successful. Following this is finding a way to easily report on the current state of your environment so you can proactively ensure you are complying with the standards defined. You should also be prepared to provide a report on-demand when an audit team is investigating.
This blog is not meant to be a how-to guide to meet HIPAA, PCI-DSS or SOC. However, it will provide you with the guidance regarding these regulations so you can apply it and understand the steps required to meet these standards.
Enforce and monitor
Regardless of whether your organization asked you to meet an internal standard, or needs to obtain and certify that the organization complies with an industry standard, compliance will always revolve around two key actions:
- Enforce policies for the access to or from a resource
- Monitor that the policy being enforced is followed.
Achieving these two steps is necessary before you can claim to be fulfilling any compliance requirements. Additionally, you need to achieve this in a Kubernetes environment where workloads are highly dynamic, policies are dynamic and logs do not have the workload identity and or context.
Keep calm and carry on with security policies
Enforcement and monitoring happens at multiple levels, and can be observed in many places. First, I would recommend that you adopt a zero trust approach, assuming that the network is always hostile. This means that when it comes to policy creation, you apply default-deny policies for all connections, using explicit policies only for allowed traffic. You should also have the tools to identify and constrain compromised endpoints. In order to implement effective security policies, you will have to follow a good labeling standard which will facilitate the creation of policies as part of build and deployment. Within the context of microservices, you can find our recommendations in this blog, Kubernetes security policy design: 10 critical best practices, where we talk about label standards and best practices for Kubernetes security.
Labels can be used to identify endpoints backing microservices of a given application. Those endpoints can then be selected in security policies for defining controls for microservice communication to internal and external endpoints. Typically, a deployment model following one application per namespace fits most customer requirements, except for shared services, which typically need to be deployed in their own namespaces to be accessed by multiple tenants. It is recommended that you attach application micro-segmentation labels to pods.
The Calico Manager UI provides an extensive policy enforcement capability that allows you to implement granular application microsegmentation.
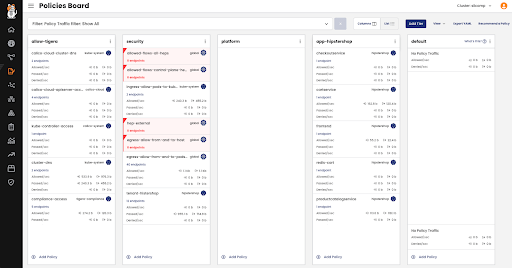
The policy board provides a clear understanding of which policies are applied through its tiered approach. The board is read from top to down and left to right.
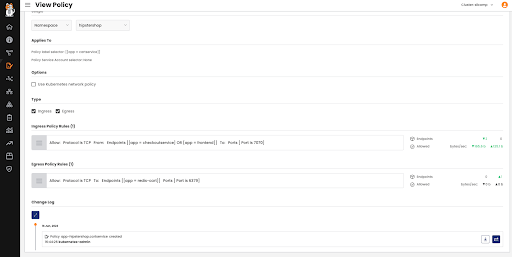
Viewing the security policy will clearly display the traffic being allowed, helping you validate that only intended traffic is allowed. You can also use the policy lifecycle capabilities, including staging, preview, enforcement, and monitoring. Below, you will see a change log that displays all the changes made to this policy, allowing you to identify who made what changes and when.
Being able to enforce policies is as important as being able to track the changes made.
Make sure you implement appropriate role-based access controls (RBAC) to allow policy implementation for the authorized personas in your organization and in the right scope.
You can apply policies to endpoints, network sets and host endpoints which allows you to extend policies outside the core pod network.
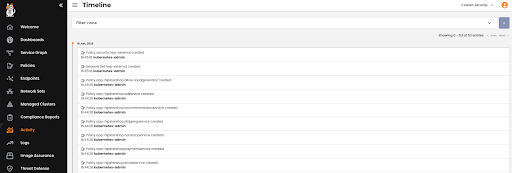
The timeline board displays all the changes applied to the environment, providing another point of reference for administrators to monitor.
Flow and audit logs
Before going any further, note that from a deployment perspective, it is important to ensure that you enable auditing for Kubernetes resources as well. Kubernetes resources such as pods, namespaces, service accounts, or Kubernetes policies are involved in network security policy evaluation and are required for Compliance Reports, which themselves are run from Elastic.
You can quickly verify by validating that the following flags are present for your kube-apiserver:
--audit-log-path=/var/log/calico/audit/kube-audit.log
--audit-policy-file=<path to file containing audit policy above>
More on policy logging available here.
The Calico-specific resources are handled by our API server which we automatically configure for audit and flow logs.
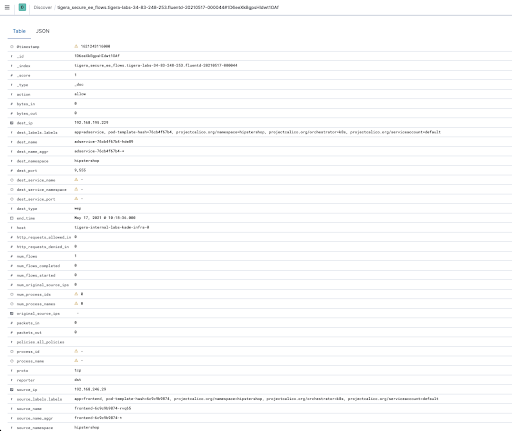
The flow logs will provide extensive data on each of the flows, including information about source, destination and policy, all of which is time-stamped so historical data can be retrieved and analyzed.
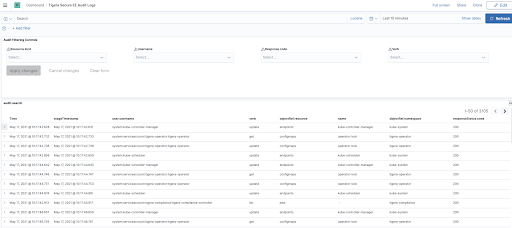
The audit dashboard displays historical data with any modifications applied to the different objects of the environment, identifying the nature of the modification and by whom it was applied.
Flow and audit logs can be shipped to your external SIEM to meet your long term retention and compliance requirements.
So whether you want to enforce, audit, or validate changes to policies, all are available, giving you the foundation for a compliant environment.
Time to shine: Proving Compliance
Now that you’ve configured your compliance policies, how can you prove compliance? How can you ensure that compliance policies will be applied to specific applications and services?
Hypothetically you could try to have all your environment be compliant but usually it’s only a subset of the environment that requires the compliance. Not to mention that compliance has a cost—infrastructure over the historical data that needs to be kept, usually for months, and also in compute in order to keep reports, benchmarks, and databases running.
The second step is going to scope which application or part of the application you need to report on so that you can tune the reports to focus only on this subset.
Pre-defined compliance report
One of the challenges of showing compliance is being able to gather and present the relevant data to the auditing authorities in a clear and concise manner. Another benefit of being able to pull reports easily is enabling you to check that your compliance needs are met on an ongoing basis.
Calico comes with four predefined compliance report formats that cover all aspects of your Kubernetes environment. Report permissions are granted using the standard Kubernetes RBAC based on ClusterRole and ClusterRoleBindings. This allows you to enable the different teams to pull their own reports based on their application requirements.
Compliance reports are based on archived flow logs and audit logs and are available in formats:
- Inventory report
- Network access report
- Policy audit report
- CIS Benchmark report
Reports access log data associated with the following resources:
- Pods
- Host Endpoints
- Service Accounts
- Namespaces
- Kubernetes service endpoints
- Global Network Sets
- Calico and Kubernetes Network policies
- Global Network Policies
The format follows the example below:
apiVersion: projectcalico.org/v3
kind: GlobalReport
metadata:
name: nameofyourreport
spec:
reportType: inventory
schedule: 0 0 * * 0
jobNodeSelector:
nodetype: infrastructure
- Name: Name of the report and how it will appear under the Compliance dashboard
- Report Type: One of the 4 report types predefined. We will go through them later on.
- Schedule: The schedule follows format: Minute (0-59) | Hour (0-23) | Day (1-31) | Month | Day of the Week (0-6 Sunday-Sat)
- Reports are started 30 minutes after the schedule to allow enough time for data archival. A maximum of 12 schedules per hour is enforced (one every 5 minutes on average)
- jobNodeSelector: Scope of the report
CIS Benchmark
This report is a bit different. It refers to the Centre for Internet Security which is the primary recognized industry-standard for secure configuration guidance.Being able to assess your Kubernetes clusters against CIS benchmarks is a standard requirement for most organizations.
CIS Benchmark provides prescriptive guidance for establishing a secure configuration posture for your IT infrastructure, including your Kubernetes clusters. Plus, it strengthens your threat detection capability, providing a more comprehensive view beyond looking only at network data.
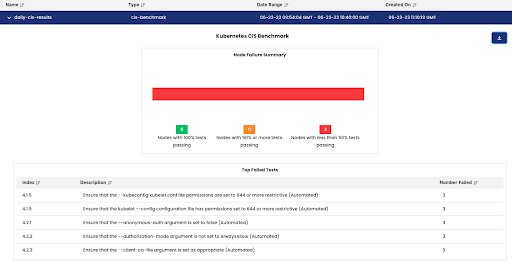
The most direct form of output is the dashboard that shows a bar graph of how many nodes have tests passing within a given set of percentage thresholds. Underneath is a table that shows the tests that the most nodes have failed.
Additionally, note the download button on the top right corner of the dashboard that allows the user to download the reports in various csv formats for further processing. The “total summary” report is essentially a textual representation of the bar graph shown from the dashboard. The “node summary” shows a per-node enumeration of how many tests have passed, failed, and skipped. A skipped test is one that cannot be automated by the underlying tool that executes the benchmarks (i.e. 1.6.3: Create network segmentation using Network Policies). Skipped tests are not counted toward the percentage calculation used to determine their ranking threshold.
The compliance reporting feature provides you with a comprehensive view of your environment at any given time and step needed to improve your score.
The final step
We saw in the first part how and where you could enforce security and monitor security policies in order to be compliant regardless of the ever changing state of your Kubernetes environment.
In the second step we saw how you can create reports in order to present the needed data in a readable and understandable format without having to manually correlate multiple logs from multiple sources.
The final step is how to map a compliance requirement, sometimes following business logic or abstracted from Kubernetes reality, into your own environment and reality.
You will need to take this step on your own as compliance and requirements are legion, evolve frequently, and can be bespoke or region specific.
However if you are curious to see how we tried to make it for PCI-DSS, SOC2, HIPAA, NIST, I would encourage you to go and get inspired by the following white papers:
Join our mailing list
Get updates on blog posts, workshops, certification programs, new releases, and more!